Summary
- The S&P 500’s high valuation is justified by strong earnings growth, AI-driven disruption, and increasing international revenue exposure.
- Despite a forward P/E near 23x, SPY benefits from tech dominance, AI CapEx tailwinds, and broadening economic growth supporting higher margins.
- I remain constructive on equities, favoring cyclical value, AI infrastructure, and housing stocks over passive S&P 500 exposure for better alpha.
- Investors should focus on fundamentals, diversification, and companies with strong balance sheets and AI adoption, as this market environment is truly different.

Orla/iStock via Getty Images
Introduction
I cannot tell you how many articles I have written this year when we have discussed the market’s unfavorable valuation. What I do know is that the number is so high that it would be an incredible waste of time to actually try to figure out what the number is.
There are many reasons why we have discussed the valuation so much. For starters, a forward multiple of early 23.0x is one of the most expensive numbers in many decades.
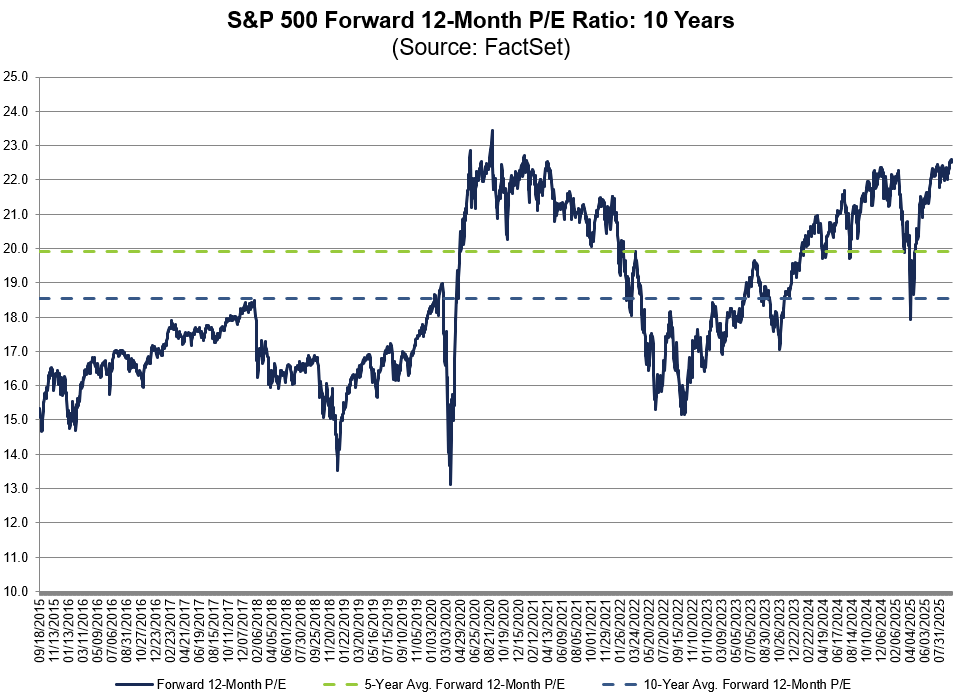
FactSet
As we can see below, the higher the market’s valuation, the lower the implied future return.
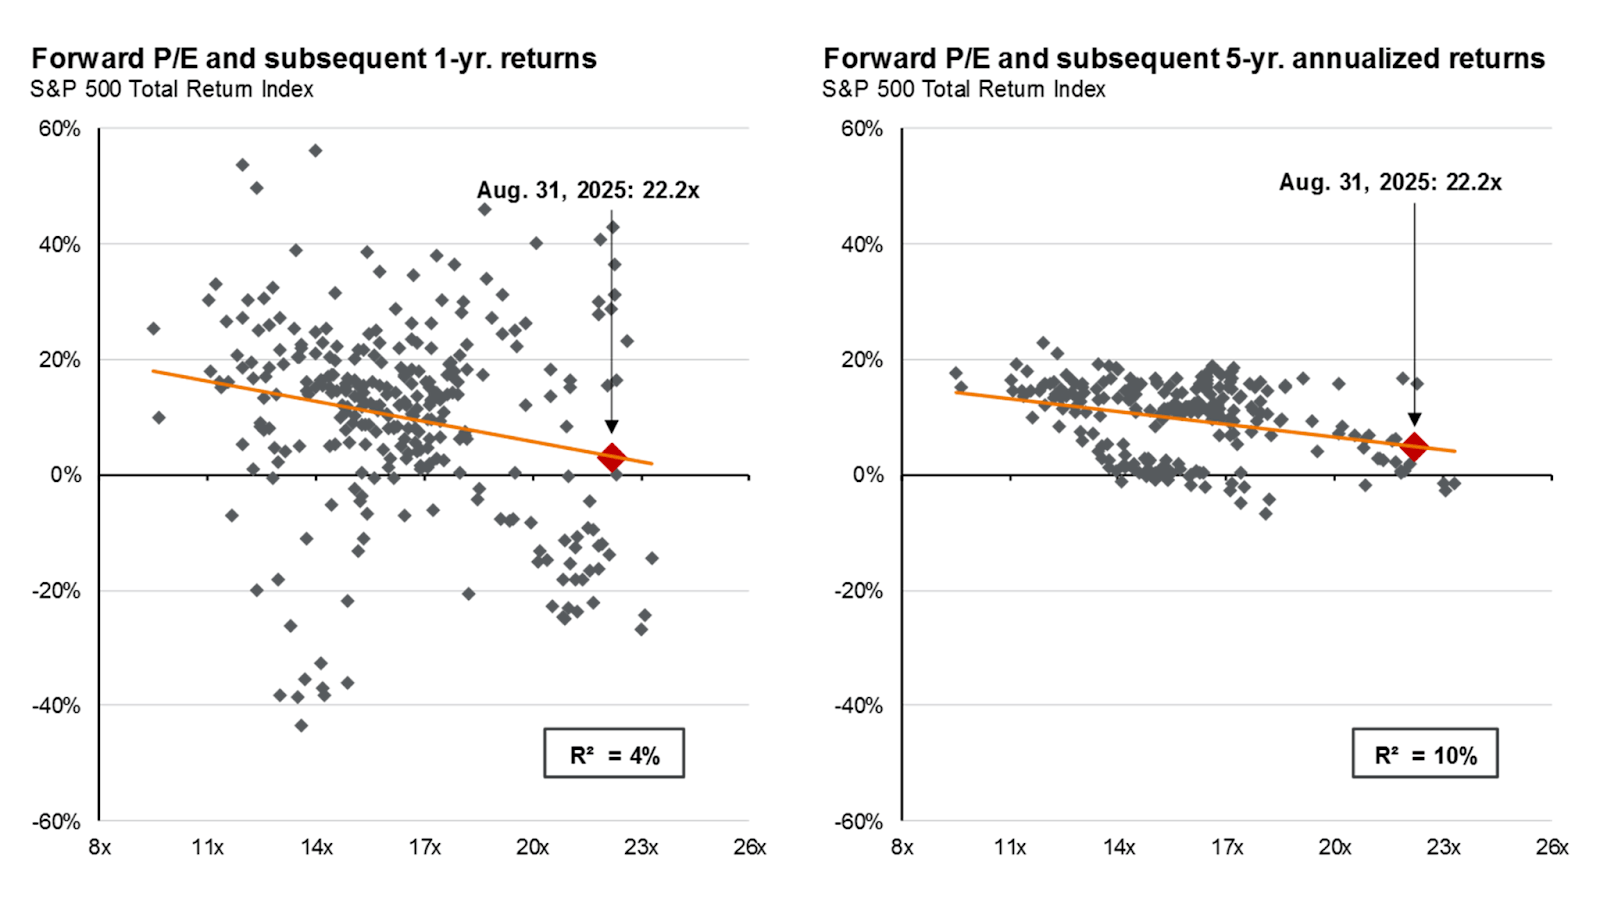
JPMorgan
Despite these unfavorable developments, I haven’t written a single bearish article on the market. If anything, we have spent a tremendous amount of time assessing this valuation through the lens of unusual developments. As I always say, “This time is different” is a great saying, as every single situation in the stock market is always unique.
Think about it, right now, there are a lot of things going on that impact the market:
- We are dealing with massive AI disruption, which could fuel earnings growth.
- The market is extremely top-heavy, as its biggest ten holdings account for nearly 40% of its weighting.
- President Trump and the Fed seem to be willing to sacrifice the fight against inflation to boost cyclical growth, lower the real value of the national debt, and support nominal growth in general.
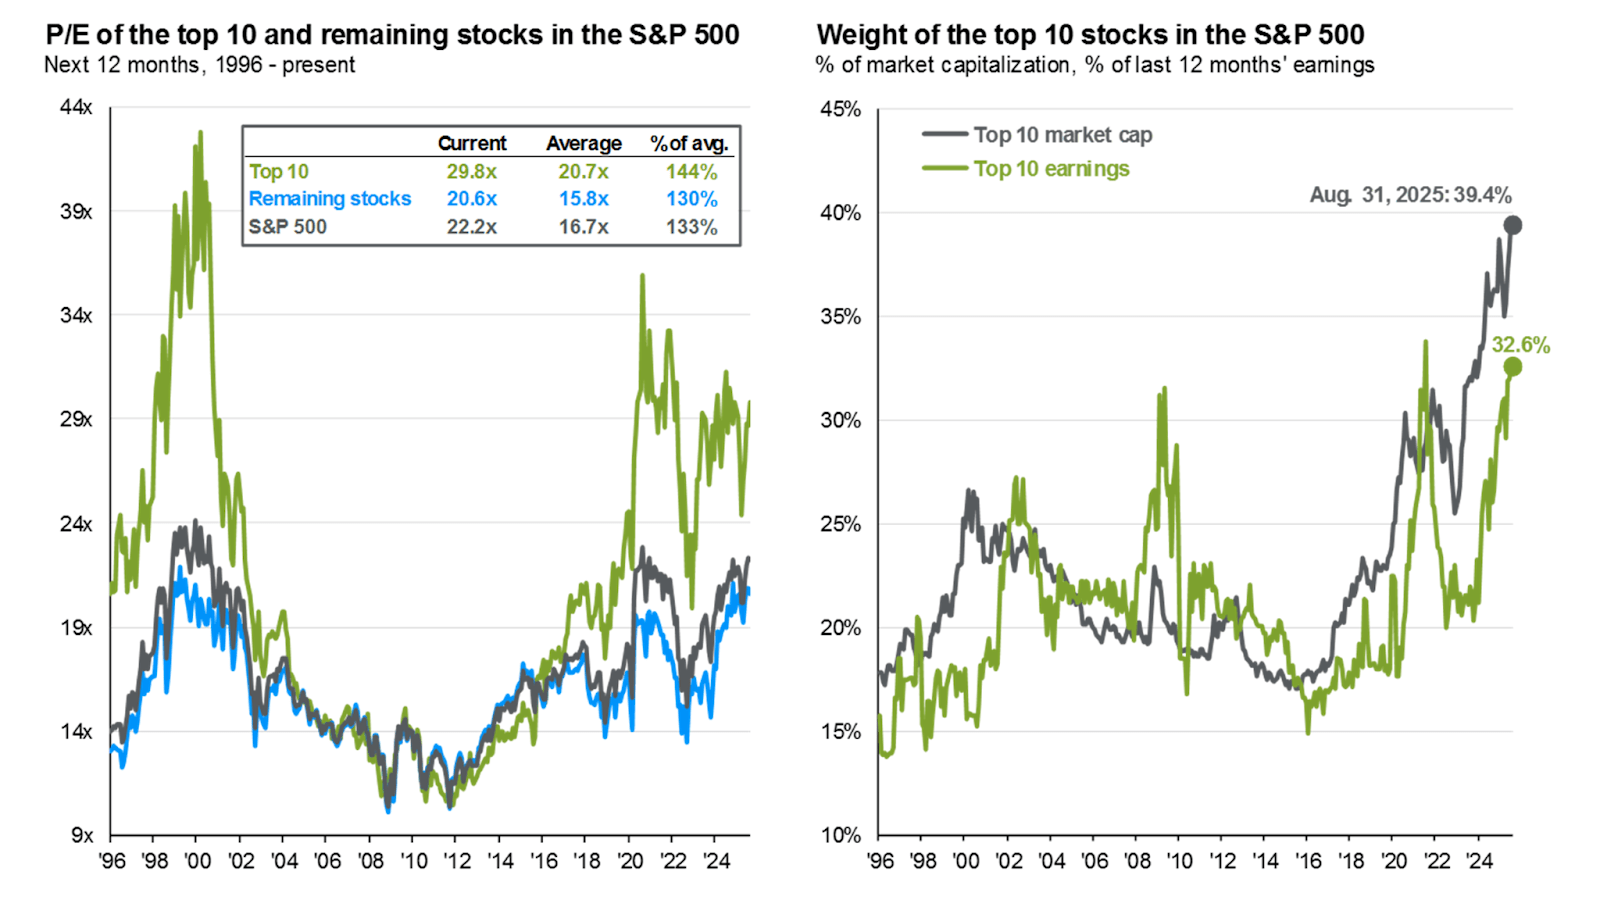
JPMorgan
While the stakes are obviously high, given that paying nearly 23.0x for next year’s expected earnings means there is no room for error, we are also not dealing with a “straightforward” market due to a wide range of factors that all impact earnings growth and valuations.
Hence, I decided to make this a special article about the market, the risk/reward going forward, and the plumbing underneath it. Essentially, I want to zoom in a lot and assess key market drivers to get a better picture of what this means for our portfolios and asset allocation.
So, as we have a lot to discuss, let’s get right to it!
The Market’s Complex – Very Complex
Depending on who you ask, people will often tell you the market returns roughly 10% per year. At least, that seems to be the rule of thumb many have used to quickly assess how much money frequent index fund investments might be worth in the future.
As it turns out, that’s pretty accurate.
Using SoFi numbers, the average S&P 500 return is about 8% to 12% per year. That’s 6% to 7% after inflation. In other words, 10% is a good number to keep in the back of one’s head. The funny thing is that using an average only makes sense when planning on holding stocks for the long run. As we can see below, it rarely happens that stocks actually return 10%.
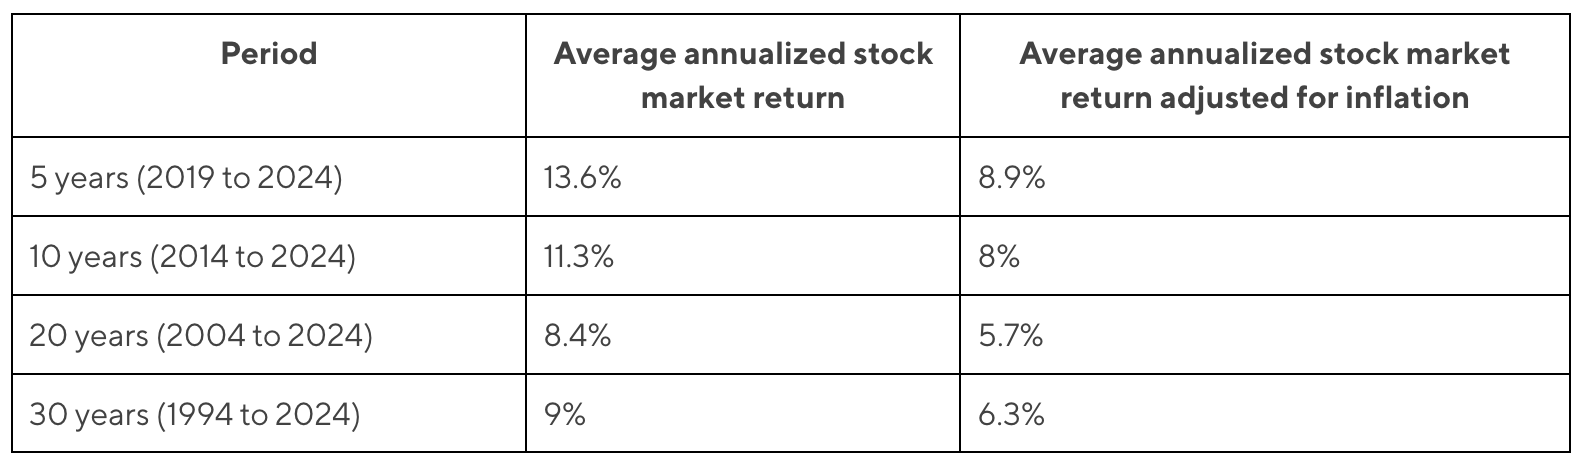
SoFi
Based on the data in the overview below, we see annual returns were positive in 34 out of the past 45 years. The average year saw a 14.1% drop. Almost every year saw outlier returns, meaning it confirms that we can only use the 10% number with a long-term horizon.
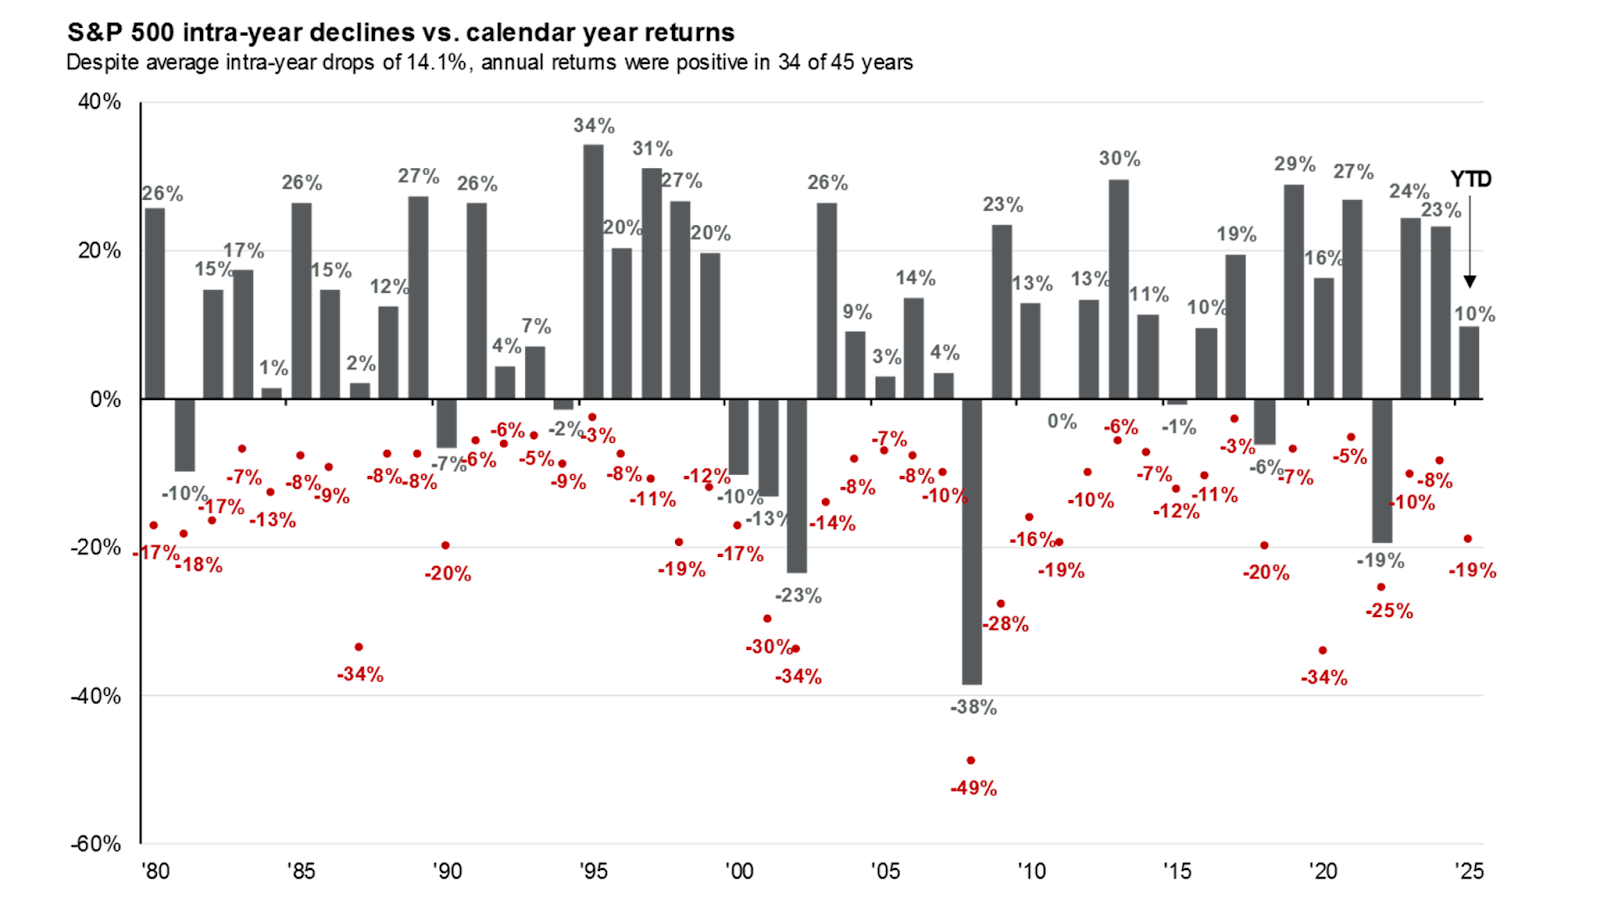
JPMorgan
But that’s not what this article is about. What this article is about are market drivers. After all, where is this 10% coming from? Why can we use it as a rule of thumb?
For starters, economic growth is obviously important. Economic expansion is favorable for stocks. Recessions tend to be bad news for stocks. That said, I think it’s fair to say the market doesn’t move in lockstep with GDP. After all, GDP growth looks nothing like the market returns in the JPMorgan chart above. This means many other factors are at play.
Using Columbia Threadneedle research, one of the best ways to approach the market is by dividing its returns into two factors based on Keynes’ findings. These components are enterprise returns and speculative returns. I like to call this “facts” and “opinions.”
- Enterprise returns are earnings growth and dividends.
- Speculative returns are changes in valuation.
This looks something like this:
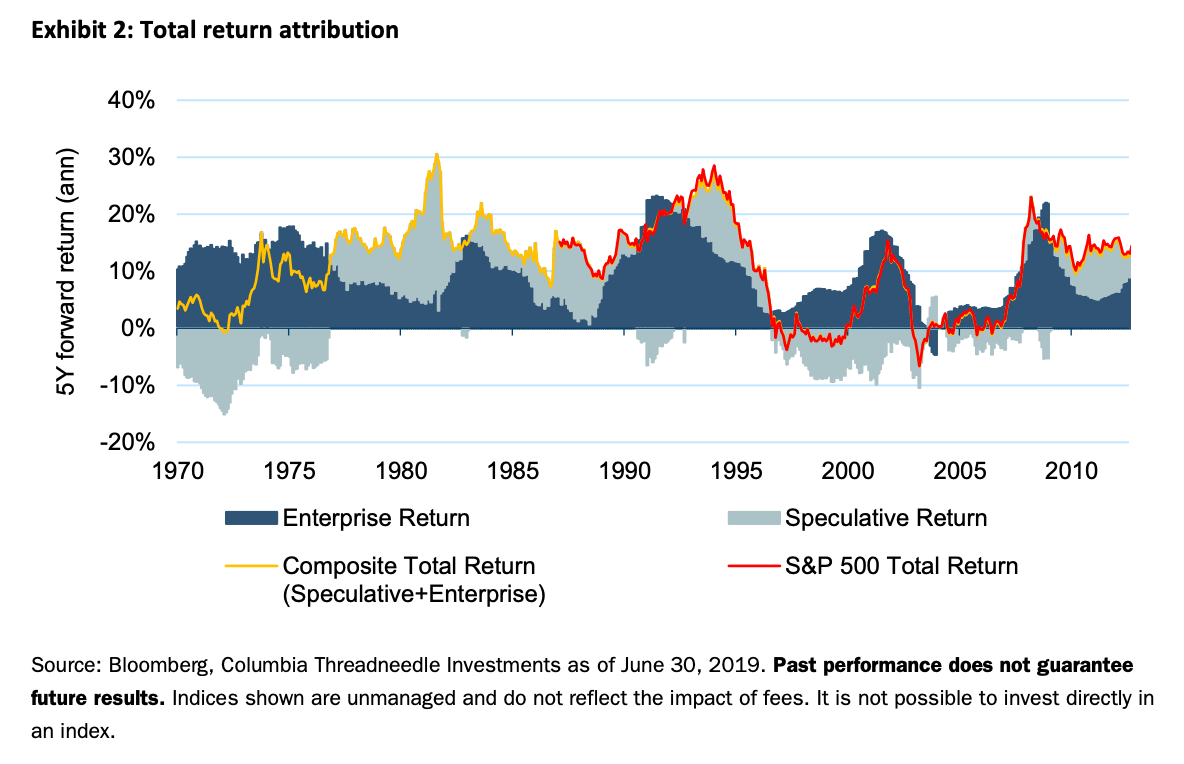
Columbia Threadneedle
The chart above is from 2019. But that’s OK. As it proves that, in the past, the combination of enterprise returns and speculative returns has driven the S&P 500.
This makes total sense.
For example, let’s assume you buy stock in Company A. It trades at 20x earnings and grows its earnings by 5% every single year. If the valuation remains unchanged, your stock will go up by 5% per year. Now, assume that the company also pays a 3% dividend. If we exclude taxes, you now get a total return of 8% per year.
But wait, the company also buys back 1% of its shares each year. This reduces the number of shares, increasing the value per share. Now, your total return is 9% per year. Essentially, it’s a combination of earnings growth and the total payout yield (buybacks + dividends).
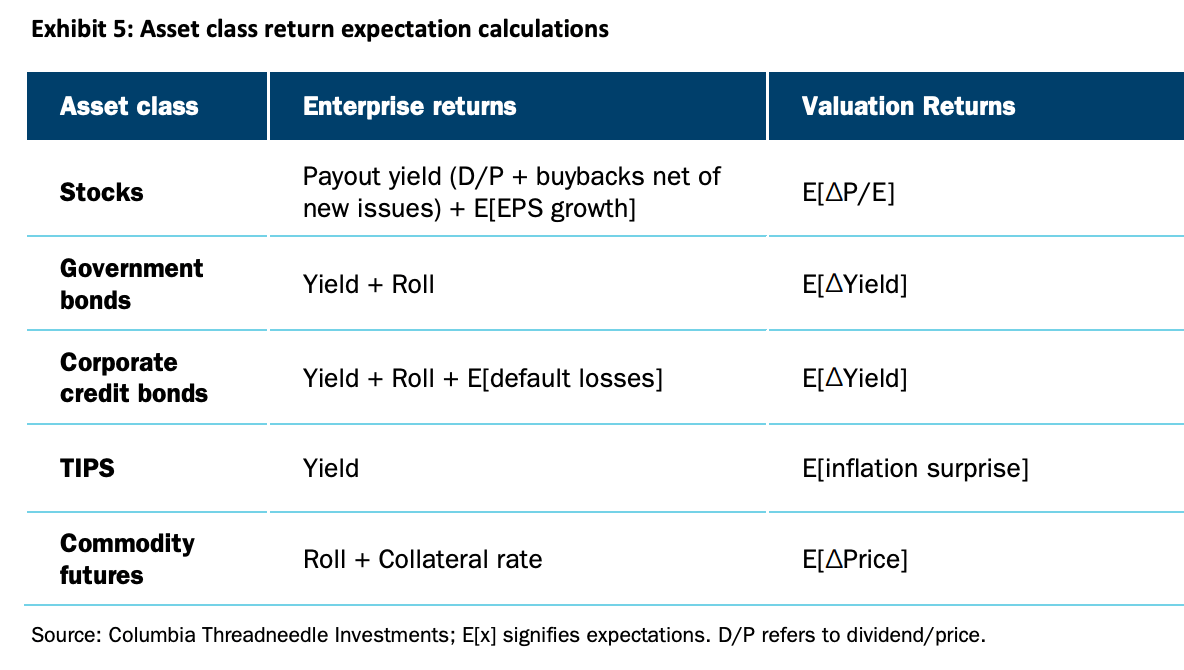
Columbia Threadneedle
As dividends and buybacks are usually less volatile than earnings growth, it’s fair to make the case that enterprise returns are largely driven by earnings growth. Columbia Threadneedle calls the dividend a “carry” return, as investors get paid for holding a stock.
Now, the next step is to be aware that earnings growth includes inflation. As the next chart shows, the total enterprise return relies on earnings, income (the dividend), and inflation. For example, a company that sells houses can grow its revenue if sales volumes remain unchanged and prices rise. That’s also why pricing/inflation is such a big factor when investing in stocks like oil and gas producers and fertilizer companies. Price trumps volumes.
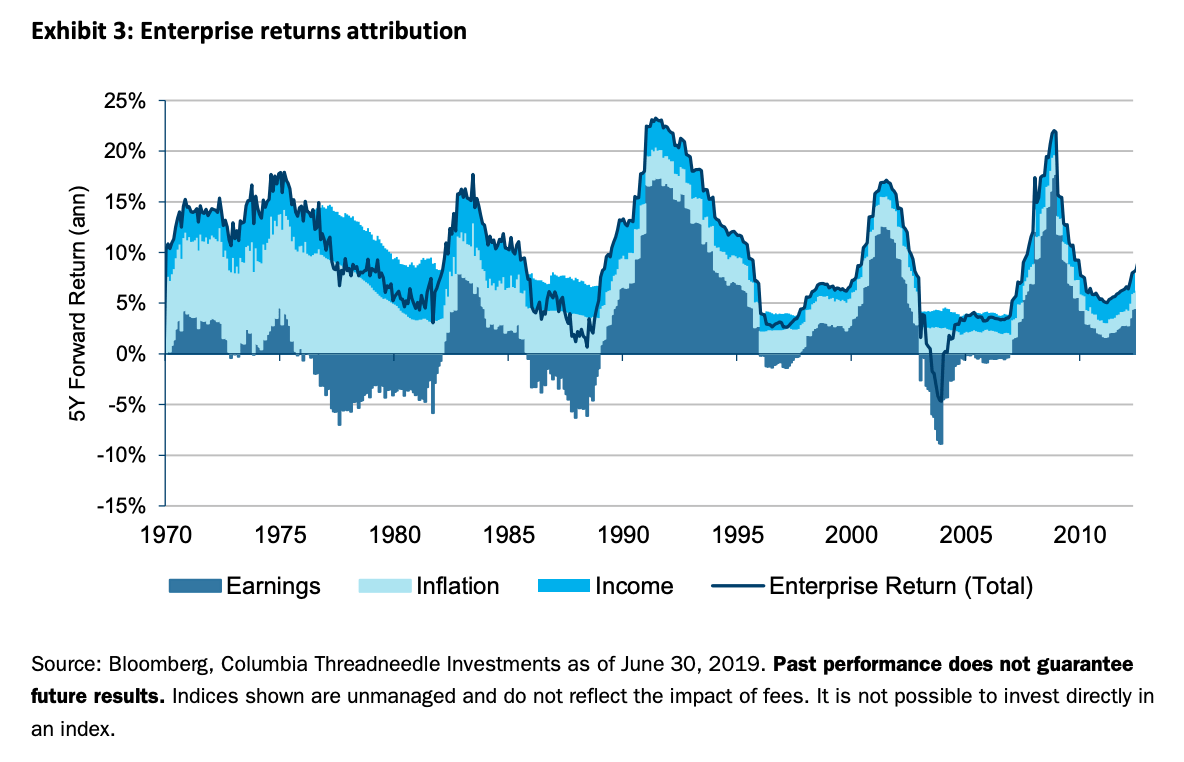
Columbia Threadneedle
Especially in the 1970s and 1980s, inflation was the main driver of enterprise returns, as economic growth was sluggish, inflation was elevated, and uncertainty was high. In general, it was a very tough period for the market and investors.
Then there’s the speculative return. This one is fun, as it relies on so many factors.
Going back to Company A, the 9% annual return (5% earnings, 3% dividend, 1% buybacks) could be substantially higher if its 20x P/E multiple were to rise on a consistent basis. This tends to happen to companies where the market expects growth to rise in the future. It could also be the result of a healthier balance sheet, stronger margins, and other factors.
Needless to say, the same applies to the stock market. The S&P 500 is just a collection of many companies that, put together, should give us a good overview of the economy. I know there are some twists, but more on that later in this article.
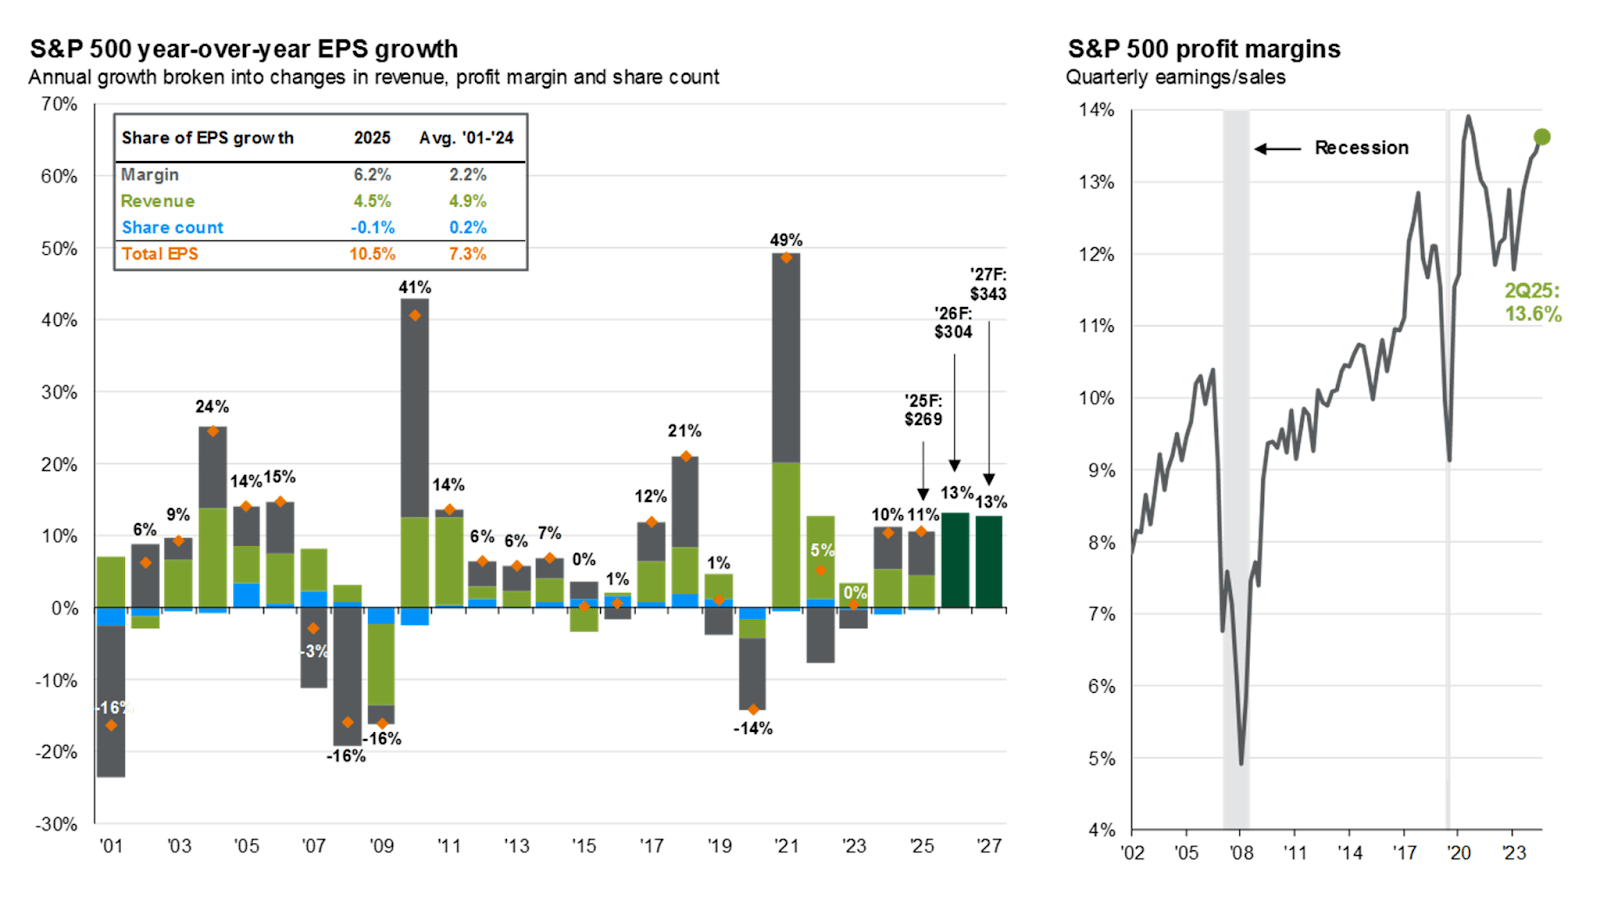
With that said, since 2001, the S&P 500 has seen 7.3% average annual EPS growth.
The breakdown below shows that 4.9 points of this came from revenue growth. Higher margins added 2.2 points. Buybacks added another 0.2 points. In other words, higher margins were a big factor that allowed the market to beat GDP growth, as S&P 500 companies did a great job of becoming more profitable.
JPMorgan
On top of that, investors often received close to 2% in dividends. More recently, that dividend has come down to a mere 1.1%, as the data below shows.
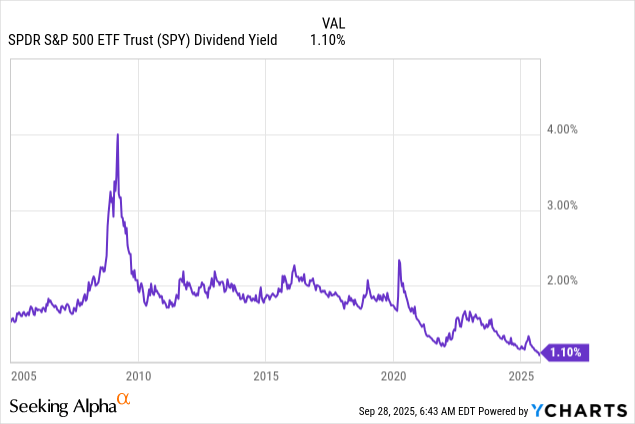
I’m using the S&P 500 ETF (NYSEARCA:SPY) as a benchmark here. This low yield is the result of two factors:
- The S&P 500 has a high valuation. A high valuation implies a low earnings yield (an earnings yield ratio is the inverse P/E ratio), which tends to pressure the dividend yield if we assume unchanged payout ratios.
- The S&P 500 has become extremely top-heavy with low-yielding growth stocks.
These two bullet points bring me to the next part of this article.
This Time is Different
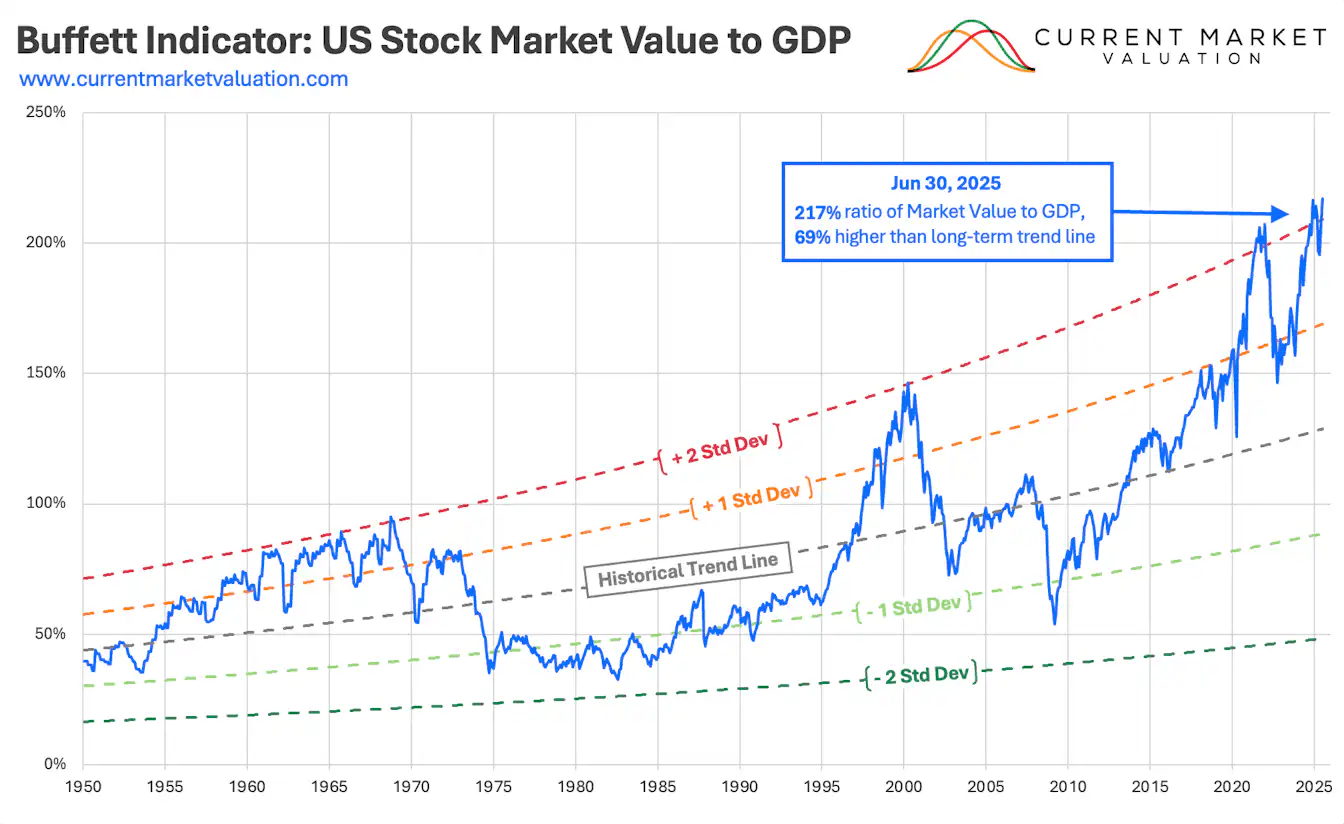
The other day, on September 21, to be precise, First Squawk reported that the so-called Warren Buffett indicator is now at 220%, above the Dot-com bubble peak of 190%. This indicator measures the total stock market value as a percentage of total GDP.
To that, I responded, “Useless indicator.”
While this was hardly a very academic take, I got a bit more likes than expected and comments from people who agreed with me.
I did not tweet this because I’m super biased but because this market is truly different.
For starters, a high ratio isn’t necessarily a good thing. As we can see below, a 220% rate (it was 217% when this chart was last updated in June) is miles above anything we have seen in recent years if we exclude the pandemic. Investors who buy the S&P 500 right now pay $2.20 for every dollar of U.S. GDP. That hardly seems like a good deal, as people paid close to $1.00 a bit more than a decade ago.
Current Market Valuation
Moreover, as we saw in the introduction of this article, the market is also far from cheap when using a forward P/E ratio.
So, what’s different?
There are a few things that come to mind:
- S&P 500 companies are increasingly less dependent on U.S. GDP. Last year, 41% of all S&P 500 revenues came from abroad. Moreover, the biggest holdings have substantially higher international exposure of more than 50%.
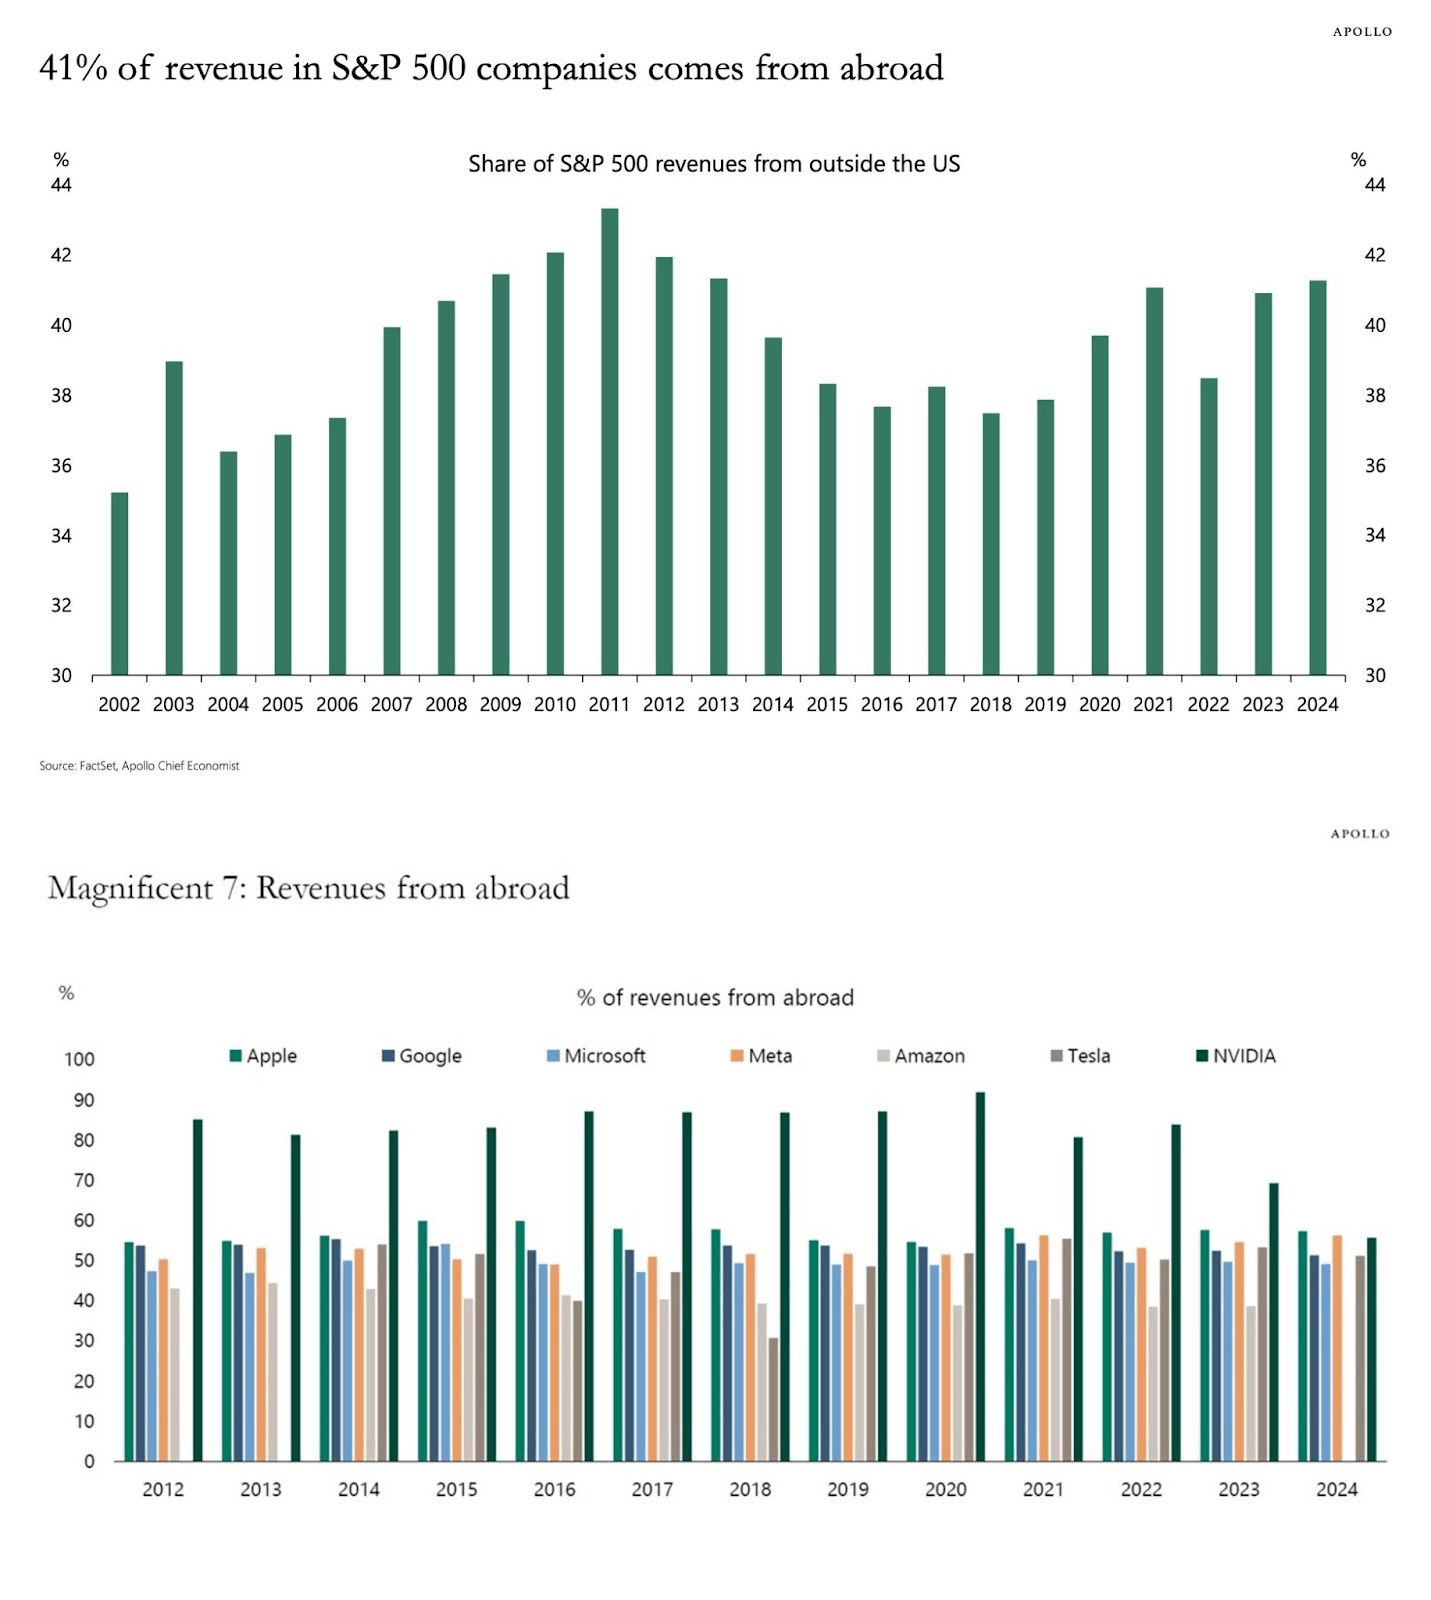
Apollo Global Management
- Because of technology, margins have rapidly increased, which has allowed the market to beat GDP growth in the past. As we saw in this article, earnings growth is expected to remain in double-digit territory. Especially in light of AI, I do not see a recession or any meaningful slowdown. On the contrary, as I see broadening economic growth, I think earnings growth will only get more support. This bodes well for margins and total revenue growth.
- There are many good reasons why the market should stick to a high multiple. For starters, the market is dominated by fast-growing tech companies. A decade or two ago, the biggest holdings consisted of capital-intensive companies like industrials.
To highlight the impact of AI once more, as I wrote in a recent article, AI is becoming the biggest disruptor since the Industrial Revolution (the first one). For now, we are still in the early stages of AI and looking at a massive acceleration to superintelligence in the years ahead. This would mean mass disruption of labor and allow efficient adopters to generate much higher margins.
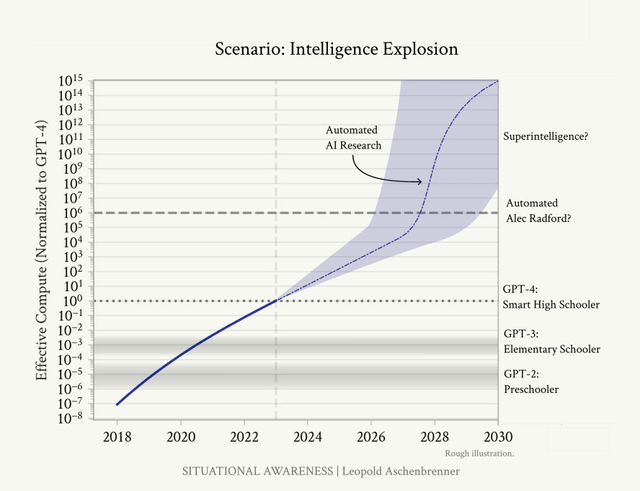
Situational Awareness/Leopold Aschenbrenner
Moreover, because of this, we are also in the first innings of actual data center CapEx, which means large companies will be plowing hundreds of billions per year (trillions on a long-term basis) into the economy. Goldman Sachs estimates that hyperscalers alone will boost annual CapEx to nearly $400 billion. This capital will rapidly hit bottlenecks like construction, power generation, labor, and other areas. I think this is incredibly bullish for manufacturing and will soon be reflected in actual leading indicators like the ISM Manufacturing Index.
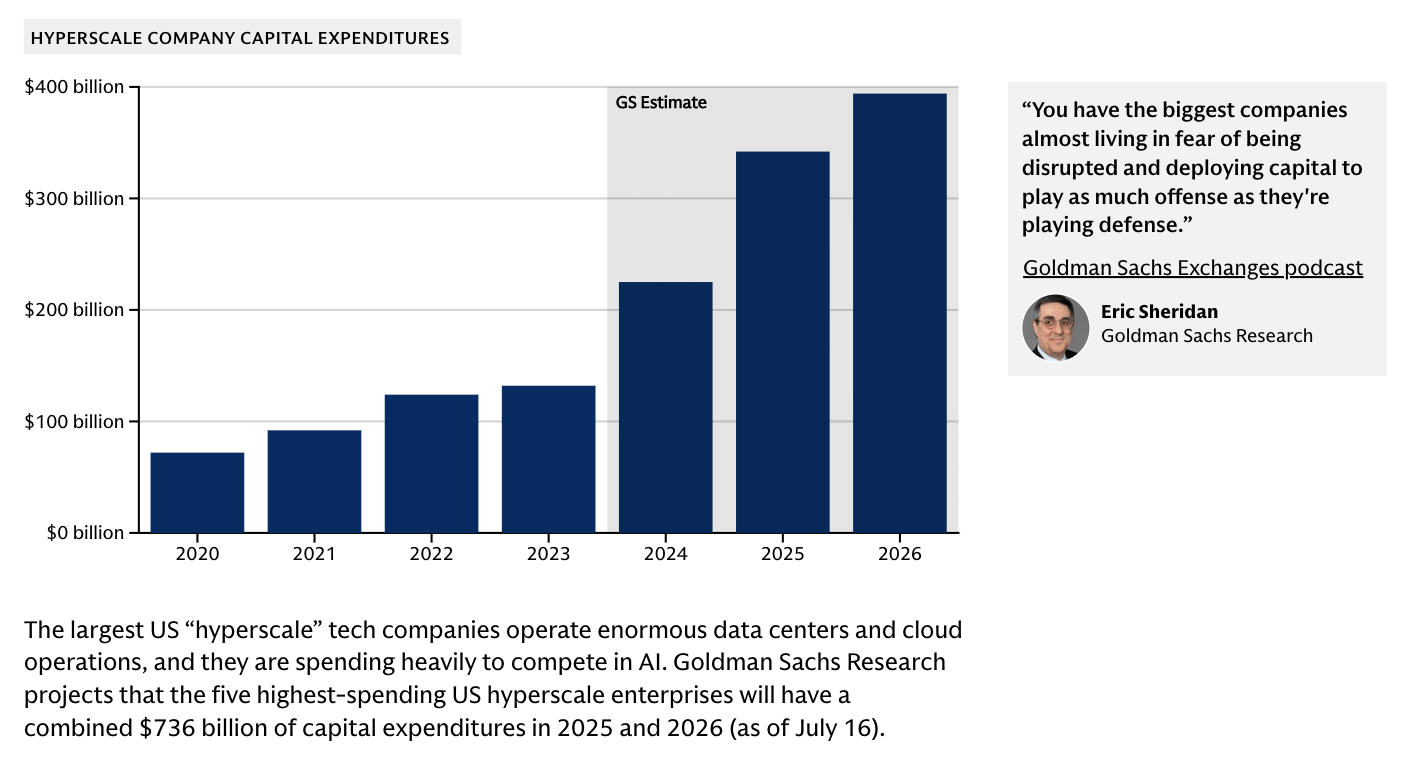
Goldman Sachs
This is great for the market’s health, as I wrote in a recent article titled “Oh Boy, The Entire Stock Market Hinges On Just 1% Of Stocks.” In that article, I discussed how the S&P 500 is now dominated by companies that are all (most of them, anyway) competing for AI leadership. They plow tremendous amounts of capital into companies further down the supply chain, which is highly beneficial for broadening economic growth, especially as spending is only accelerating and bottlenecks like limited power improve pricing power for many companies and extend the duration of this trend.
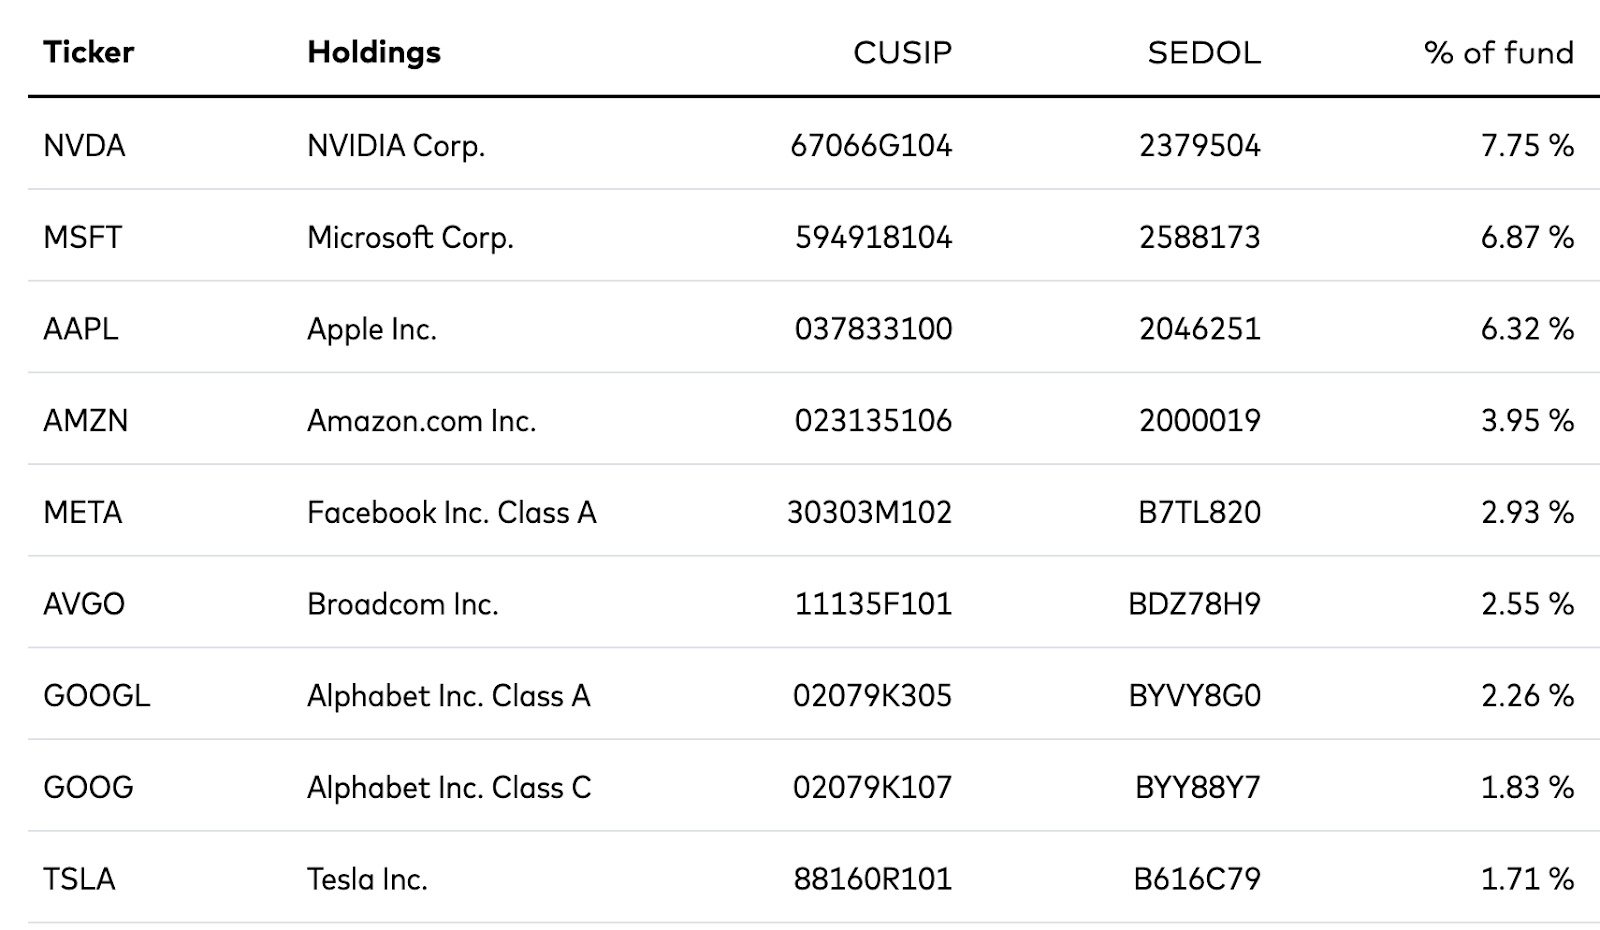
Vanguard (VOO S&P 500 ETF)
In other words, while the stock market may not be cheap (I will not make that case), there are many good reasons why I and many others continue to invest:
- AI disruption fuels revenue growth, margins, and could see much bigger benefits once we get to the superintelligence (and mass adoption) stage.
- The S&P 500 is very different from the past. It has more high-margin growth stocks in its biggest holdings, and the benefit of broadening economic growth supports the other 90% of its holdings.
- The S&P 500 is increasingly benefiting from non-U.S. GDP growth.
- The Fed and the government seem to be extremely focused on growing nominal growth, easing the fight against inflation. This benefits liquidity and is a great reason to keep buying assets, even at elevated valuations (what’s the alternative? Cash?)
- Higher-for-longer earnings growth will support higher valuations.
The market’s valuation will become an issue once investors feel earnings growth is on thin ice. This could be triggered by a recession, a trade war, or unusual events like pandemics. However, for now, I don’t see any of that happening.
In other words, to go back to my S&P 500 mini-lecture, I see tailwinds for market enterprise returns and steady speculative returns. This tends to be very healthy for bull markets.
So, Now What?
I didn’t want to end this article without spending a few words on my personal strategy. While this may not be news to my most regular readers, it may help new readers better understand what goes on in my head as I put money to work.
While I have warned investors about the low margin of error for the S&P 500, I am not bearish. In fact, I don’t even believe in a recession, let alone stagflation. I believe in higher cyclical growth, higher S&P 500 margins, and many years of AI CapEx tailwinds that are slow to get off the ground due to major bottlenecks in power and infrastructure.
Given these factors, I have invested aggressively in cyclical value stocks in the past two years. This includes energy (Canadian Natural (CNQ), LandBridge (LB), and Texas Pacific (TPL)), industrials like Union Pacific (UNP) and Old Dominion Freight Line (ODFL), as well as AI infrastructure like Comfort Systems USA (FIX), which has become my largest investment at 15% of my portfolio.
I also like housing stocks, as I am convinced we will see a lot of effort from the Trump administration and the Fed to unlock this stuck market. Here, I like stocks like Watsco, Inc. (WSO), which distributes AC units, parts, and services; Carlisle Companies (CSL), which produces materials for commercial and residential remodeling and construction; and Boise Cascade (BCC), a major building distribution company.
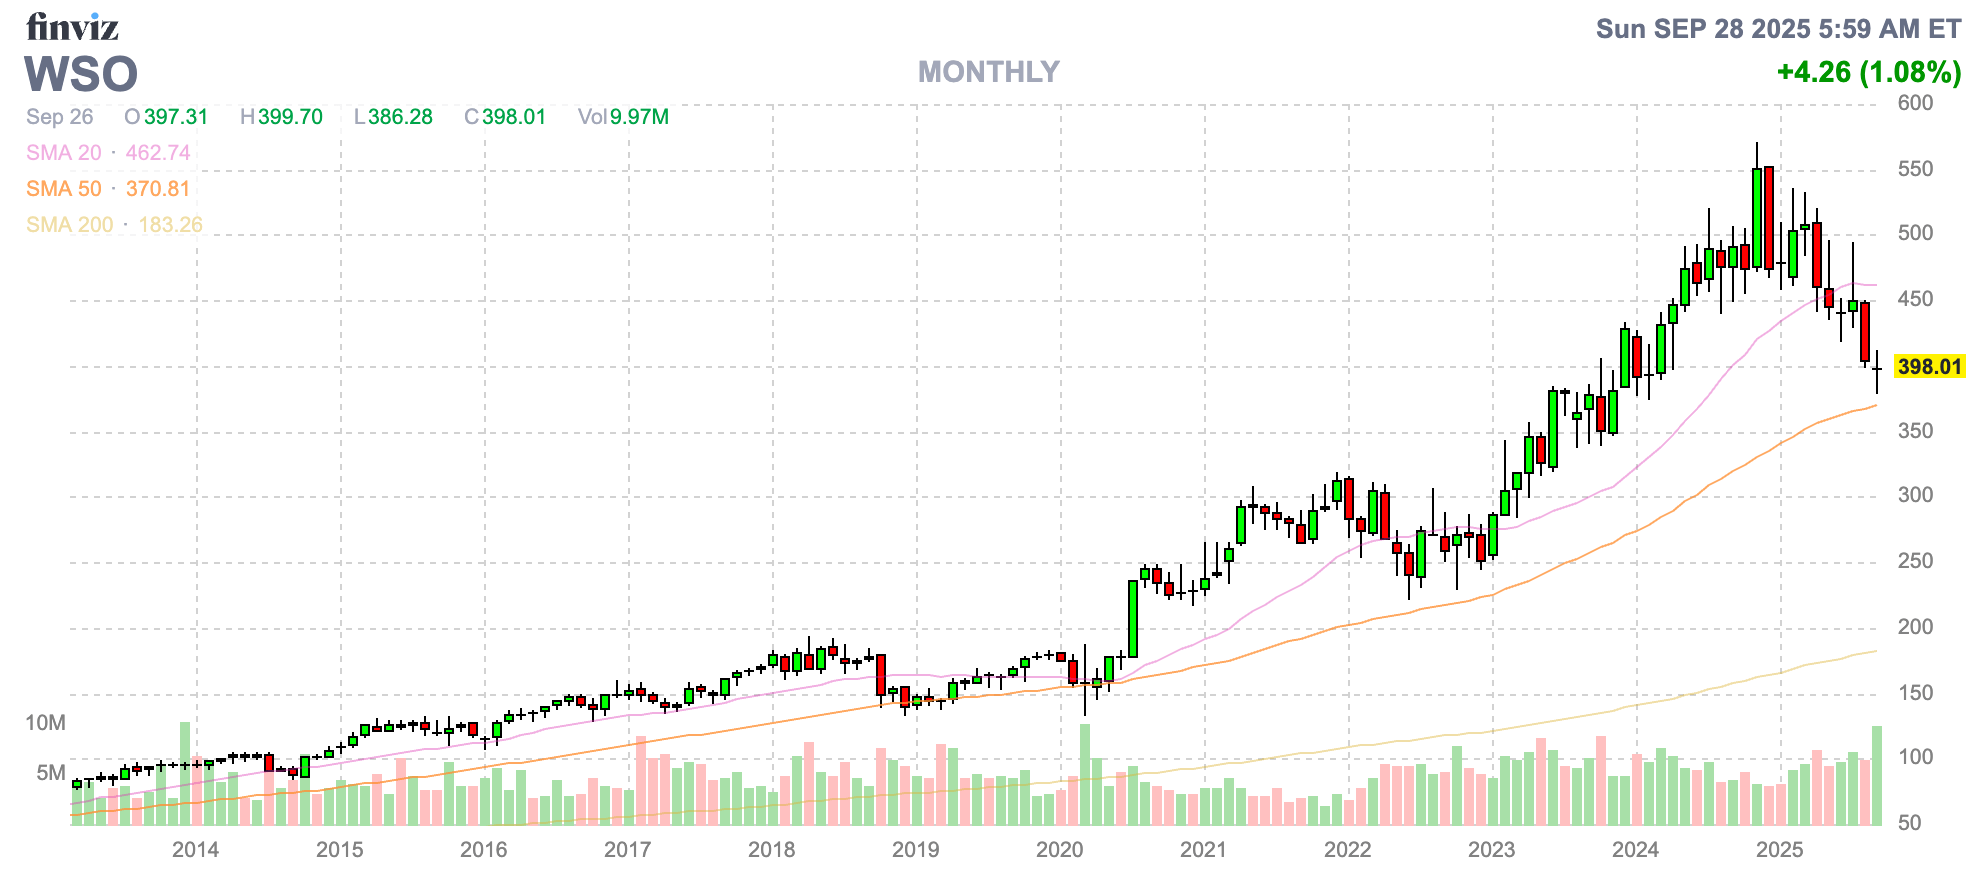
FINVIZ
I also have many similar stocks on my watchlist, as I believe broadening economic growth and AI margin tailwinds will give the S&P 500 support. I just think we need to diversify in order to generate substantial alpha. I believe a simple investment in the S&P 500 may not deliver the results it has had over the past ten years.
In other words, to get back to the core of this article, I’m betting big on my belief that enterprise returns will remain strong and speculative returns will hold steady. While I fully get the concerns that people have (I will continue to monitor and discuss all major developments), I think this time is truly different.
And if you disagree with me and freak out about valuations, keep focusing on the fundamentals of the market and the stocks you own. Focus on companies with healthy balance sheets, wide-moat business models, and the ability to implement AI.
Regardless of whether the market trades at 23x or 18x next year’s earnings, I think this way, we’ll do just fine.
Last but not least, I will obviously provide a lot more food for thought in the form of actionable ideas going forward.
Leo Nelissen is an analyst focusing on major economic developments related to supply chains, infrastructure, and commodities. He is a contributing author for iREIT®+HOYA Capital.
As a member of the iREIT®+HOYA Capital team, Leo aims to provide insightful analysis and actionable investment ideas, with a particular emphasis on dividend growth opportunities. Learn More.
Analyst’s Disclosure:I/we have a beneficial long position in the shares of CNQ, TPL, LB, ODFL, UNP, FIX, CSL either through stock ownership, options, or other derivatives. I wrote this article myself, and it expresses my own opinions. I am not receiving compensation for it (other than from Seeking Alpha). I have no business relationship with any company whose stock is mentioned in this article.
Seeking Alpha’s Disclosure: Past performance is no guarantee of future results. No recommendation or advice is being given as to whether any investment is suitable for a particular investor. Any views or opinions expressed above may not reflect those of Seeking Alpha as a whole. Seeking Alpha is not a licensed securities dealer, broker or US investment adviser or investment bank. Our analysts are third party authors that include both professional investors and individual investors who may not be licensed or certified by any institute or regulatory body.
Shared by Golden State Mint on GoldenStateMint.com