Summary
- Strong Q3 earnings from major banks and robust consumer data support continued S&P 500 gains, despite trade tensions and market volatility.
- Chairman Powell’s comments signal imminent Fed rate cuts and an end to quantitative tightening, providing further monetary stimulus for risk assets.
- Yield curve steepening, driven by falling short-term rates, is a bullish sign distinct from past cycles that ended in recession.
- With double-digit earnings growth likely and a resilient consumer, the bull market appears set to continue into next year, favoring buy-the-dip strategies.
- This idea was discussed in more depth with members of my private investing community, The Portfolio Architect.

Getty Images
Stocks opened at their lows yesterday after China returned fire at the Trump administration overnight with sanctions on the US divisions of a South Korean ship builder. The sell-off did not last long, as third-quarter earnings reports from several of our largest banks were much better than expected, lifting sentiment. The major market indexes fell back into negative territory in the final hour after President Trump threatened China with a cooking oil embargo in his latest form of retaliation. I see cooking oil as a pea shooter, whereas rare earths are a bazooka in this ongoing trade dispute. Ultimately, the Trump administration has to come to a new agreement with China that de-escalates trade tensions, which should be interpreted as bullish by the market.
Finviz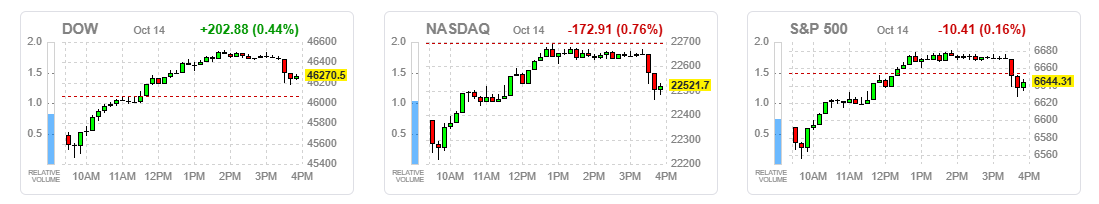
The most important development from yesterday’s session came from Chairman Powell during a speech in Philadelphia. In my view, he insinuated that another rate cut was coming at the end of this month when he stated that “the downside risks to employment appear to have risen,” based on a “wide variety of public- and private-sector data that have remained available” after the government shutdown. While acknowledging that the rate of inflation remained elevated at 2.9%, this seemed like a lesser and more transitory concern given that it has been due to core goods price increases from tariffs. The two-year Treasury yield, which is a proxy for where the market sees the Fed’s short-term rate headed, fell to a three-year low of 3.47%.
Bloomberg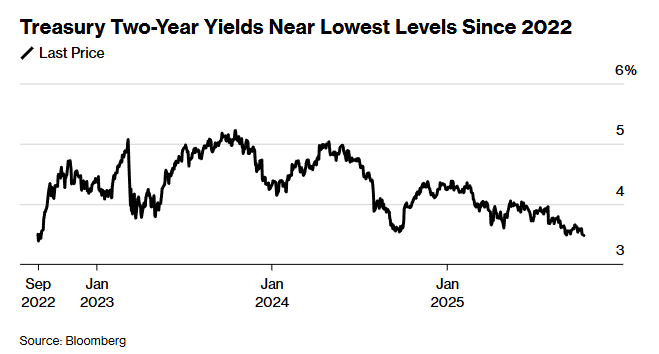
The market now sees two more rate cuts coming at the end of this month and in December. In addition, Chairman Powell indicated that the Fed would soon stop shrinking its balance sheet, otherwise known as quantitative tightening, in a move to preserve liquidity. That would be another form of monetary stimulus in that it ends the ongoing tightening from balance sheet runoff. These are two more bullish developments in a monetary sense that should help sustain the economic expansion and propel risk asset prices to higher levels.
As a result, we should see further yield curve steepening, with the spread between the 2- and 10-year Treasury yields approaching their long-term average of 1%. I see the 10-year moving back to 4.5% in that process, as the 2-year bottoms in the 3-3.5% range near a neutral Fed funds rate. Bears suggest this yield curve steepening is bearish, as it was in 2000, 2007, and 2019, but those resulted from short-term rates rising. This steepening should come from the short-term rate falling, which is a critical distinction.
DataTrek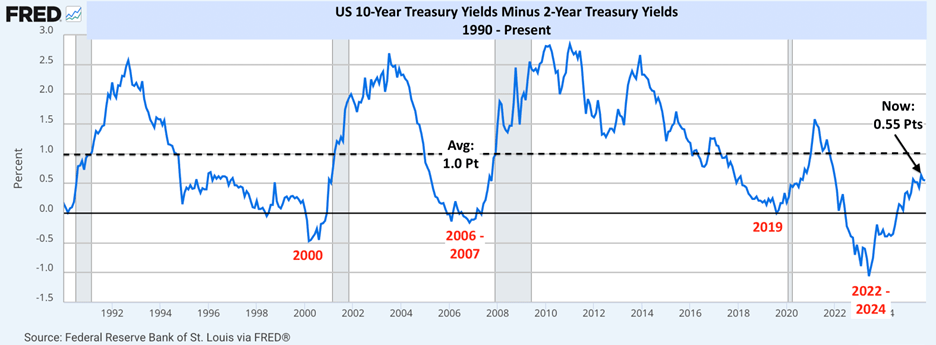
Earnings started off exceptionally strong with several of our largest banks reporting yesterday. According to FactSet, the expected earnings growth rate for the S&P 500 in the third quarter is 8%, but it is likely to be double digits once we have all the results. Earnings have exceeded estimates in 37 of the past 40 quarters, with the only exceptions being during the 2020 recession and in the second half of 2022. Over the past five years, earnings have exceeded estimates by an average of 8.4%. With fewer than 30 companies reporting so far, the beat percentage is already 3.8%, but it should rise in line with previous quarters.
FactSet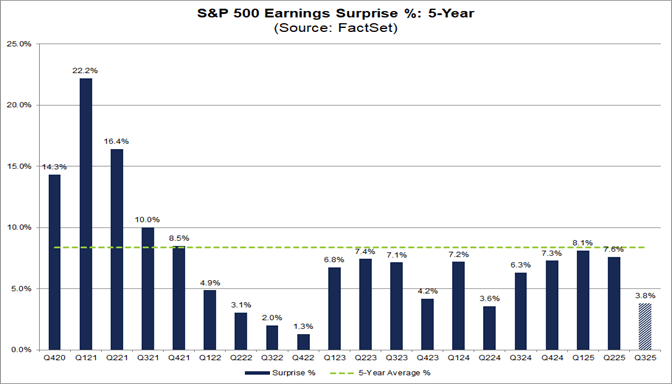
We are on track for a fourth consecutive quarter of double-digit earnings growth, which explains why the S&P 500 has rebounded from its April low. That may validate where we are, but it will be guidance that determines where we are headed. On that front, the rate of economic growth is critical.
FactSet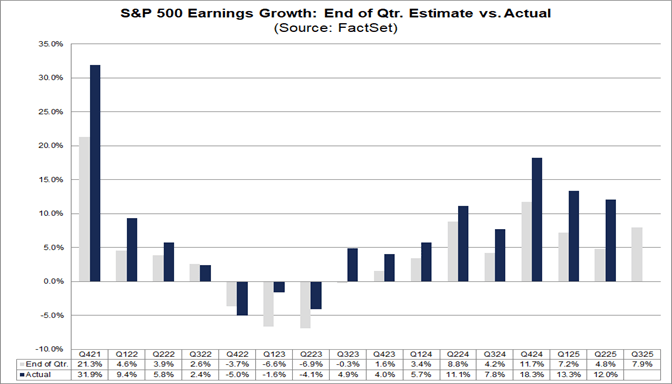
What I found notable about yesterday’s bank earnings reports is that most signs showed the consumer remains on a strong footing. Loan portfolios appear to be performing well, and credit quality is holding up with minimal changes to net charge-offs. Granted, these are higher-quality money center banks, but they account for the bulk of consumer spending. Disgruntled bears continue to focus on the weaker aspects of our economic engine, including a softening labor market, deterioration in credit for lower-income households, and a struggling housing market. I don’t dispute those headwinds, but economic data needs to be looked at in aggregate, and these smaller headwinds are more indicative of a mid-cycle slowdown in the economy rather than the end of the expansion. If investors want to be on the right side of the market, they need to make that distinction. Chairman Powell just paved the way for a soft landing next year with yesterday’s commentary, which tells me we have a fourth year ahead for this bull market. I look forward to buying the dips when they present themselves.
Lawrence Fuller has been managing portfolios for individual investors for 30 years, starting his career at Merrill Lynch in 1993 and working in the same capacity with several other Wall Street firms before realizing his long-term goal of complete independence when he founded Fuller Asset Management. He also manages the Focused Growth portfolio on the new fintech platform called Dub, which is the first copy-trading platform approved by securities regulators in the US, allowing retail investors to copy the portfolio and ongoing trades of the manager they choose automatically. You can also find him on Substack and lawrencefuller.substack.com.
He is the leader of the investing group The Portfolio Architect, which focuses on an overall economic and market outlook that complements an all-weather investment strategy designed to produce consistent risk-adjusted market returns. Features include: Portfolio construction guidance, access to an “All-Weather” model portfolio and a dividend and options income portfolio, a daily brief summarizing current events, a week ahead newsletter, technical and fundamental reports, trade alerts, and 24/7 chat. Learn More.
Analyst’s Disclosure:I/we have no stock, option or similar derivative position in any of the companies mentioned, and no plans to initiate any such positions within the next 72 hours. I wrote this article myself, and it expresses my own opinions. I am not receiving compensation for it (other than from Seeking Alpha). I have no business relationship with any company whose stock is mentioned in this article.
Lawrence Fuller is the Principal of Fuller Asset Management (FAM), a state registered investment adviser. He is also the manager of the Focused Growth portfolio on the copy-trading platform Dubapp.com. Information presented is for educational purposes only intended for a broad audience. The information does not intend to make an offer or solicitation for the sale of purchase of any specific securities, investments, or investment strategies. Investments involve risk and are not guaranteed. FAM has reasonable belief that this marketing does not include any false or material misleading statements or omissions of facts regarding services, investment, or client experience. FAM has reasonable belief that the content as a whole will not cause an untrue or misleading implication regarding the adviser’s services, investments, or client experiences. Past performance of specific investment advice should not be relied upon without knowledge of certain circumstances or market events, nature and timing of investments and relevant constraints of the investment. FAM has presented information in a fair and balanced manner. FAM is not giving tax, legal, or accounting advice.
Mr. Fuller may discuss and display charts, graphs, formulas, and stock picks which are not intended to be used by themselves to determine which securities to buy or sell, or when to buy or sell them. Such charts and graphs offer limited information and should not be used on their own to make investment decisions. Consultation with a licensed financial professional is strongly suggested. The opinions expressed herein are those of the firm and are subject to change without notice. The opinions referenced are as of the date of publication and are subject to change due to changes in market or economic conditions and may not necessarily come to pass.
Seeking Alpha’s Disclosure: Past performance is no guarantee of future results. No recommendation or advice is being given as to whether any investment is suitable for a particular investor. Any views or opinions expressed above may not reflect those of Seeking Alpha as a whole. Seeking Alpha is not a licensed securities dealer, broker or US investment adviser or investment bank. Our analysts are third party authors that include both professional investors and individual investors who may not be licensed or certified by any institute or regulatory body.
Shared by Golden State Mint on GoldenStateMint.com