Key continuation patterns known as pennants are forming in both the U.S. Dollar Index and gold, and the direction of their breakouts will signal the next major move for each.
")
After a volatile couple of months filled with relentless news and confusing cross-currents from the Trump administration’s tariff plans and other policies, the financial markets have calmed down in recent weeks—providing a much-needed breather for everyone, myself included. While it’s been quiet in the precious metals space, numerous indicators are flashing that this is merely the calm before the storm. As I’ll show in this update, another sharp move is likely right around the corner.
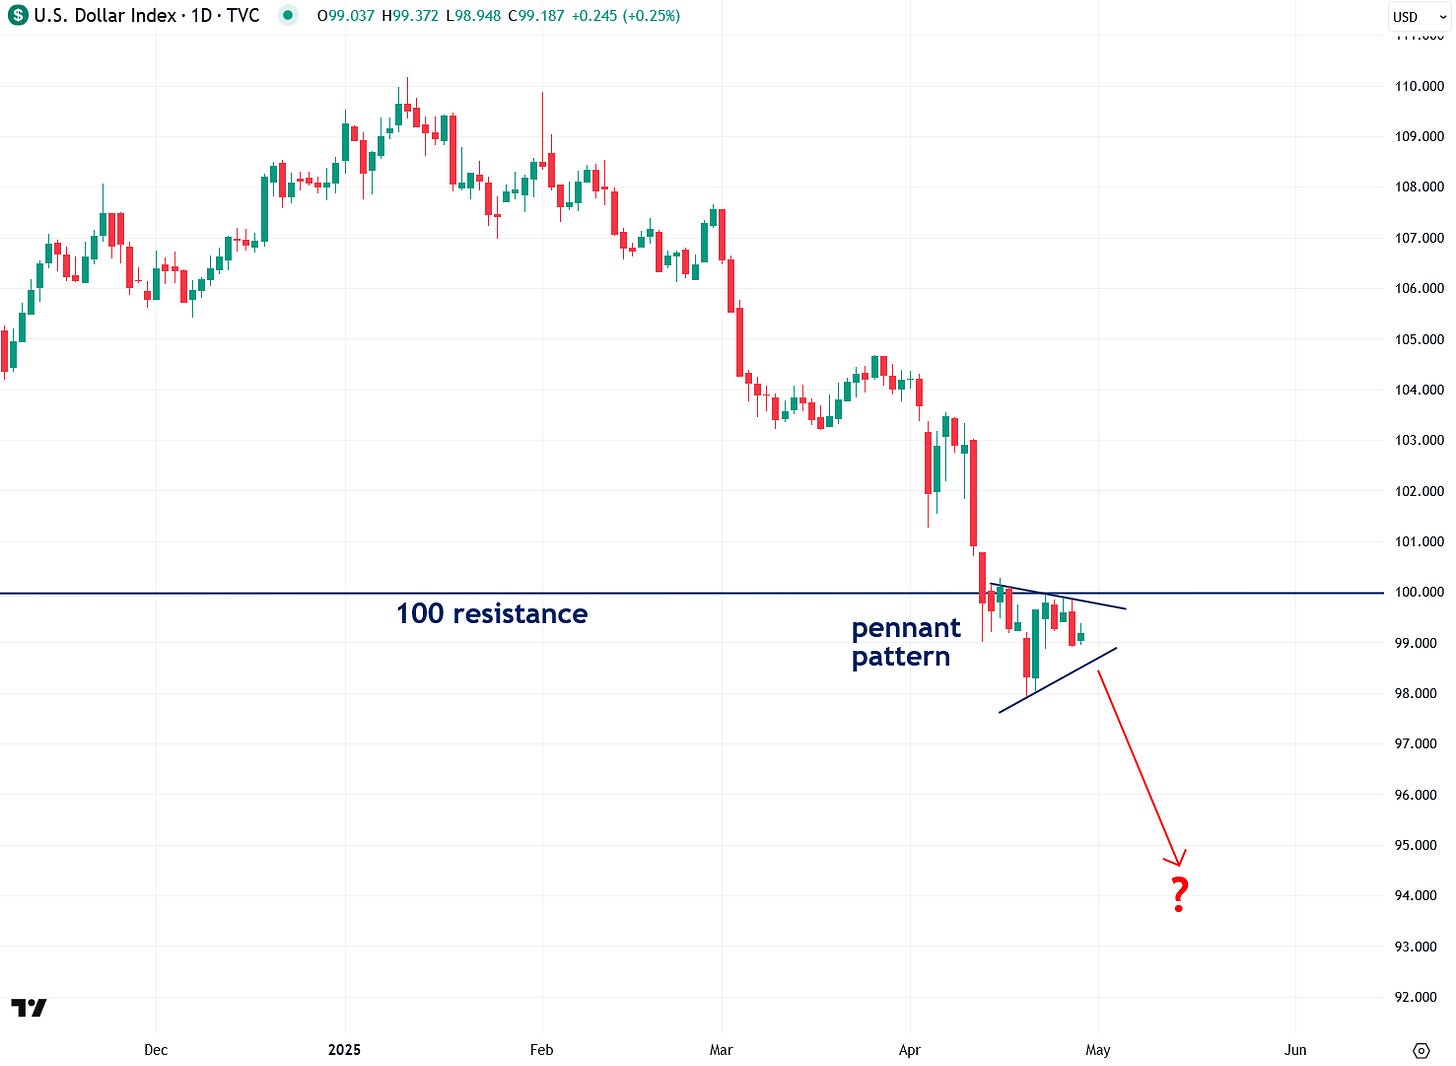
The foundation of my thesis is the U.S. Dollar Index — a measure of the dollar’s exchange rate against a basket of major world currencies (not its domestic purchasing power). As I’ve been highlighting in recent weeks, the Dollar Index is now at a critical juncture, hovering just below the key 100 level, which has served as major support and resistance for several years. Historically, rebounds off the 100 level have triggered sharp selloffs in commodities like gold and silver, due to the well-established inverse relationship between the dollar and commodity prices.
What’s especially noteworthy is that the Dollar Index recently broke below the key 100 level—a significant development that raises the likelihood of a dollar bear market (and a commodities bull market). Also worth noting is that although the dollar didn’t plunge immediately after the breakdown, it began consolidating in a pennant pattern—a technical formation that typically signals a sharp move ahead once a breakout occurs. The odds favor a downside move, as pennants are typically continuation patterns, especially with the significant 100 resistance level now looming just overhead.
My base-case scenario is that the dollar breaks down from this pattern, extending its decline. That said, I’m waiting for confirmation before making any bold calls and remain flexible to all possible outcomes.
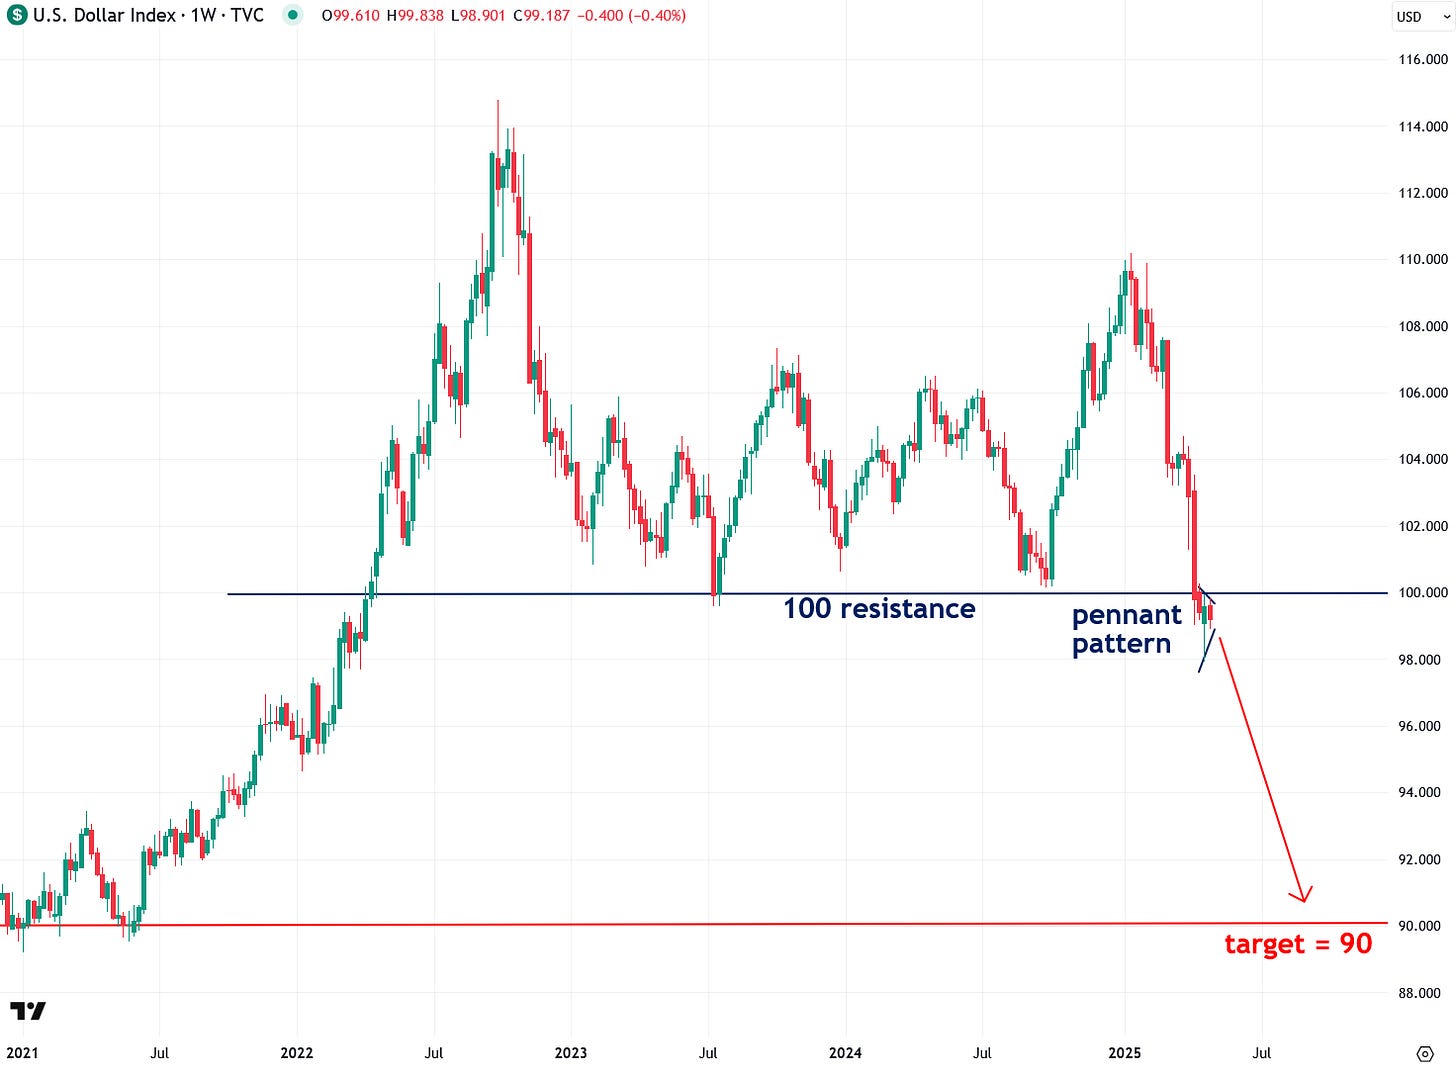
The longer-term weekly chart of the U.S. Dollar Index highlights just how important the 100 level has been in recent years. Several major rebounds have occurred off this level in the past—typically to the detriment of commodities. If the index breaks down further from here, the next key support level to watch is 90—a move that would mark a 10% decline from current levels. That’s a very realistic target, especially as we move closer to the recession and bear market I’ve been warning about.
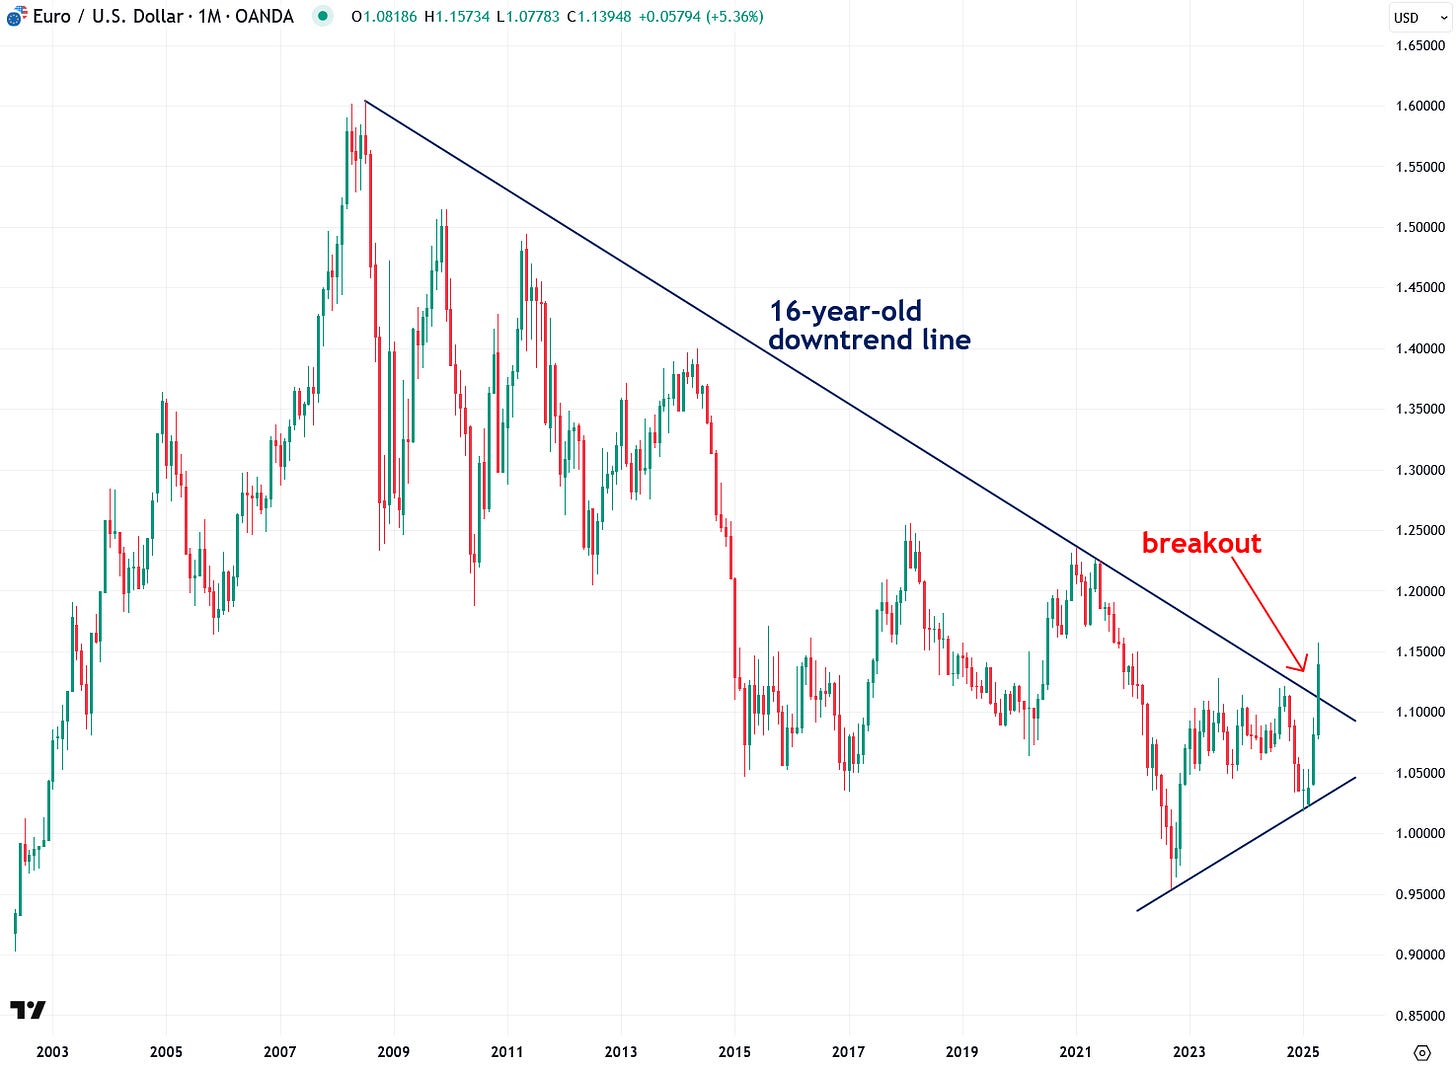
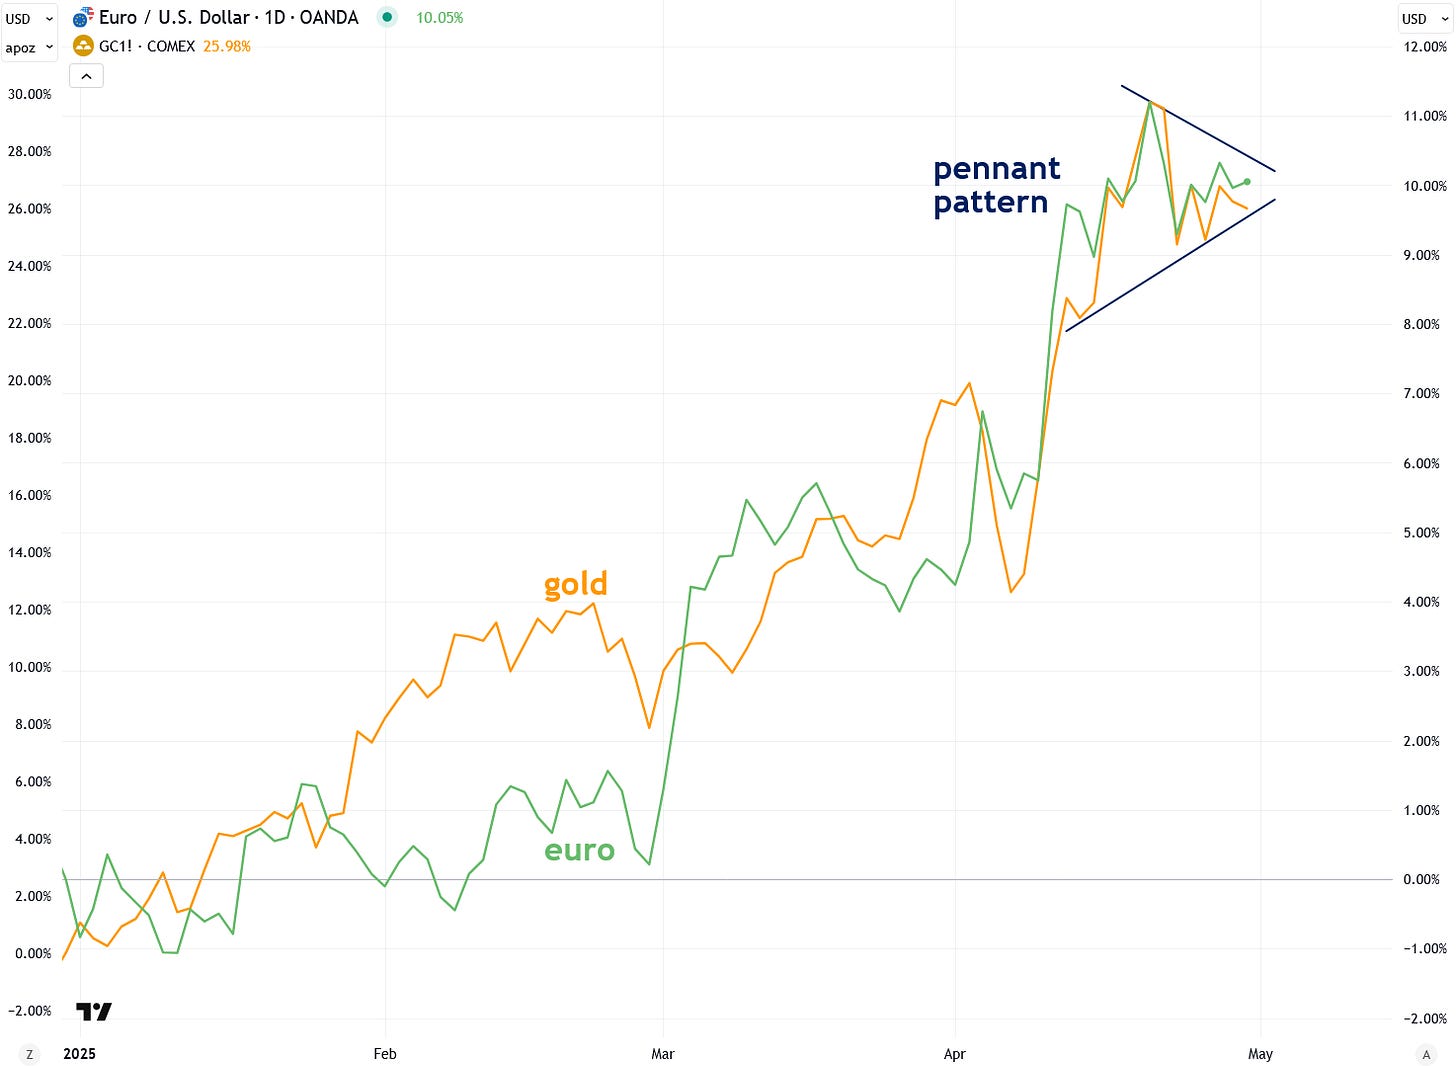
On the flip side of the potential bearish pennant in the U.S. dollar is a possible bullish pennant forming in the euro—which makes sense, given the euro (like commodities) moves inversely to the dollar. If that pattern breaks to the upside, it would signal further appreciation in both the euro and commodities.
As I explained last week, the euro has finally broken above a 16-year downtrend line against the U.S. dollar—a signal that a major shift is underway. This breakout indicates the euro may be entering a new bull market after nearly two decades of weakness, which in turn strengthens the bearish case for the dollar given their inverse relationship.
This development is especially noteworthy given the euro’s historical correlation with commodities. During the early 2000s, for example, the euro’s bull run coincided with a powerful commodities boom and a prolonged dollar bear market. History may be starting to rhyme again.
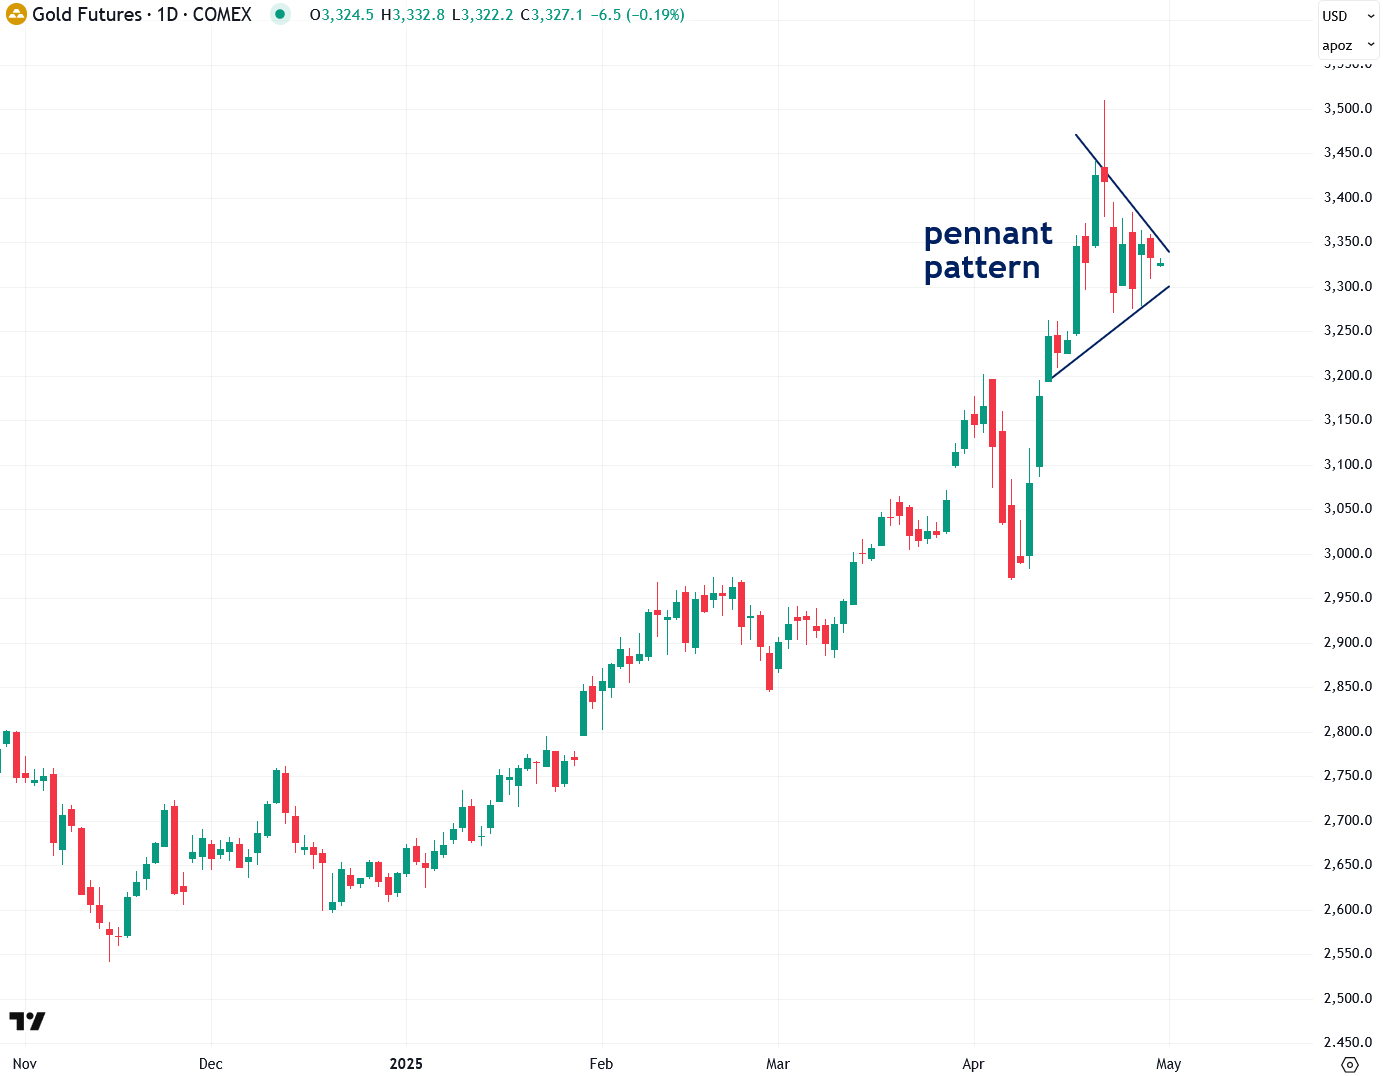
Interestingly—though not surprisingly to those who follow intermarket technical analysis—gold is also forming a pennant pattern, just like the U.S. Dollar Index and the euro. This alignment increases the odds that a major move is imminent across all three markets.
Since gold and the euro tend to move together and both trade inversely to the dollar, the direction of these breakouts will be a key signal for what lies ahead. As mentioned earlier, pennants are typically continuation patterns, which suggests a higher probability of gold breaking to the upside—but it’s crucial to stay flexible and wait for confirmation rather than acting prematurely.
Last week, I published a piece explaining that gold had become technically overbought in the short term—a reason for some caution. However, it’s important to remember that the most explosive bullish moves often occur when an asset is already overbought and has strong momentum behind it. If gold can confirm its strength by breaking out of its pennant to the upside, I wouldn’t be surprised to see it surge toward $4,000 fairly quickly, based on established pennant pattern measurement techniques.
As I’ve mentioned, gold and the euro are closely correlated—especially since the start of the year—and both have recently formed pennant patterns, which further reinforces their connection:
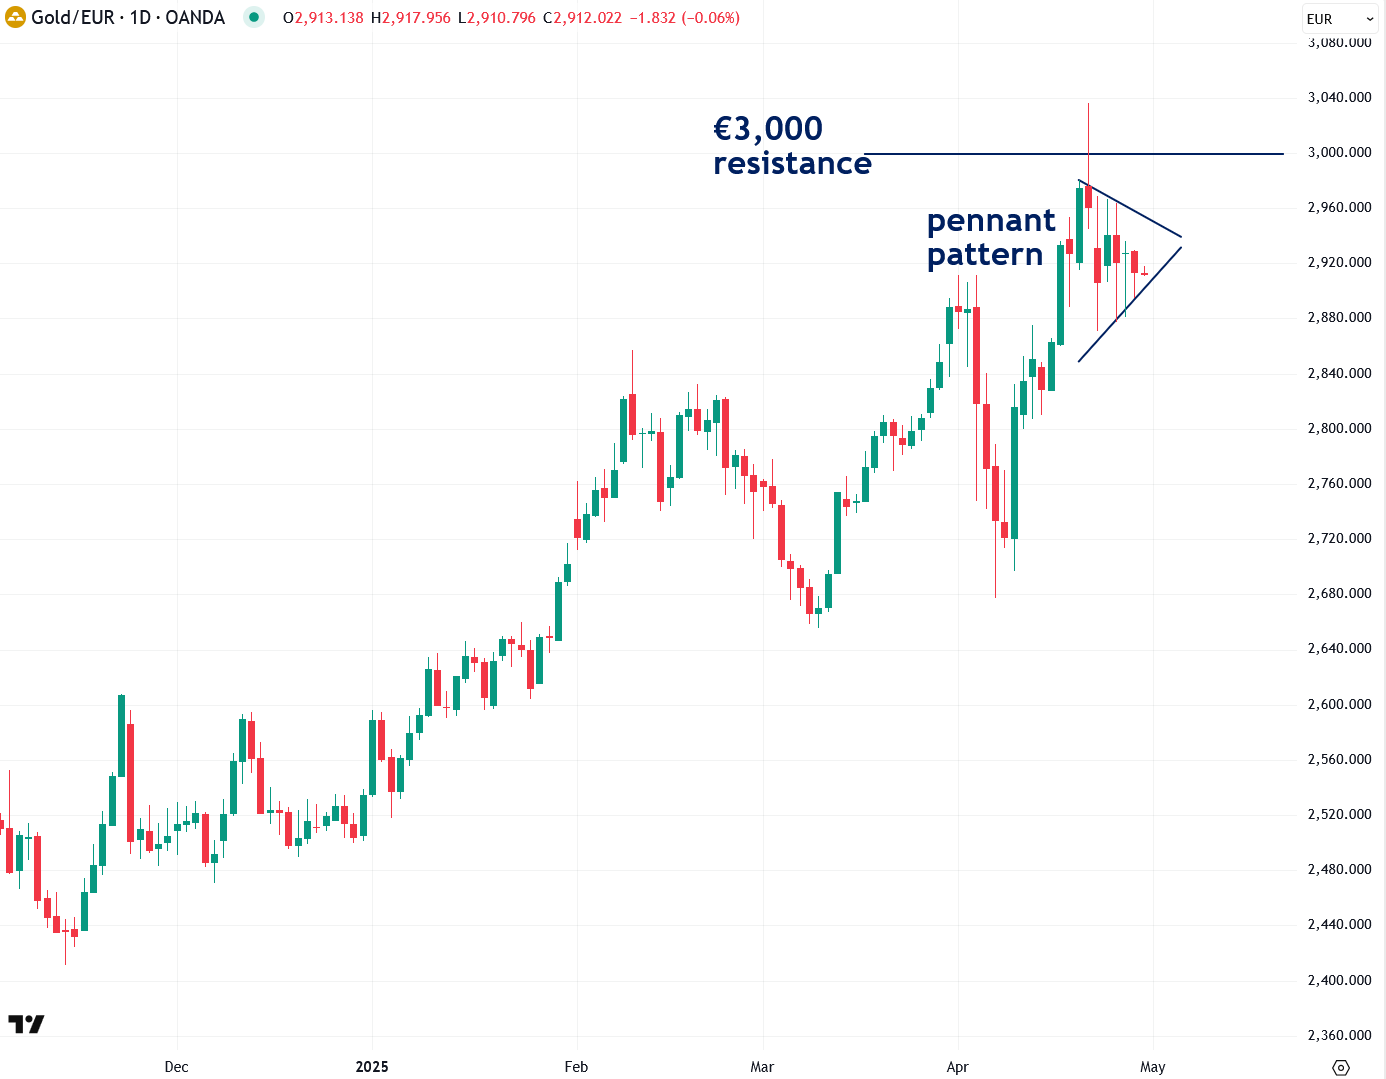
Now let’s take a look at gold priced in other currencies—a perspective I find valuable because it strips away the influence of the U.S. dollar and often reveals gold’s true underlying strength or weakness. Sure enough, gold priced in euros is also forming a pennant pattern, reinforcing the broader technical setup discussed throughout this article. It’s also worth noting that the critical €3,000 resistance level is just overhead, and a decisive breakout above it would serve as strong bullish confirmation.
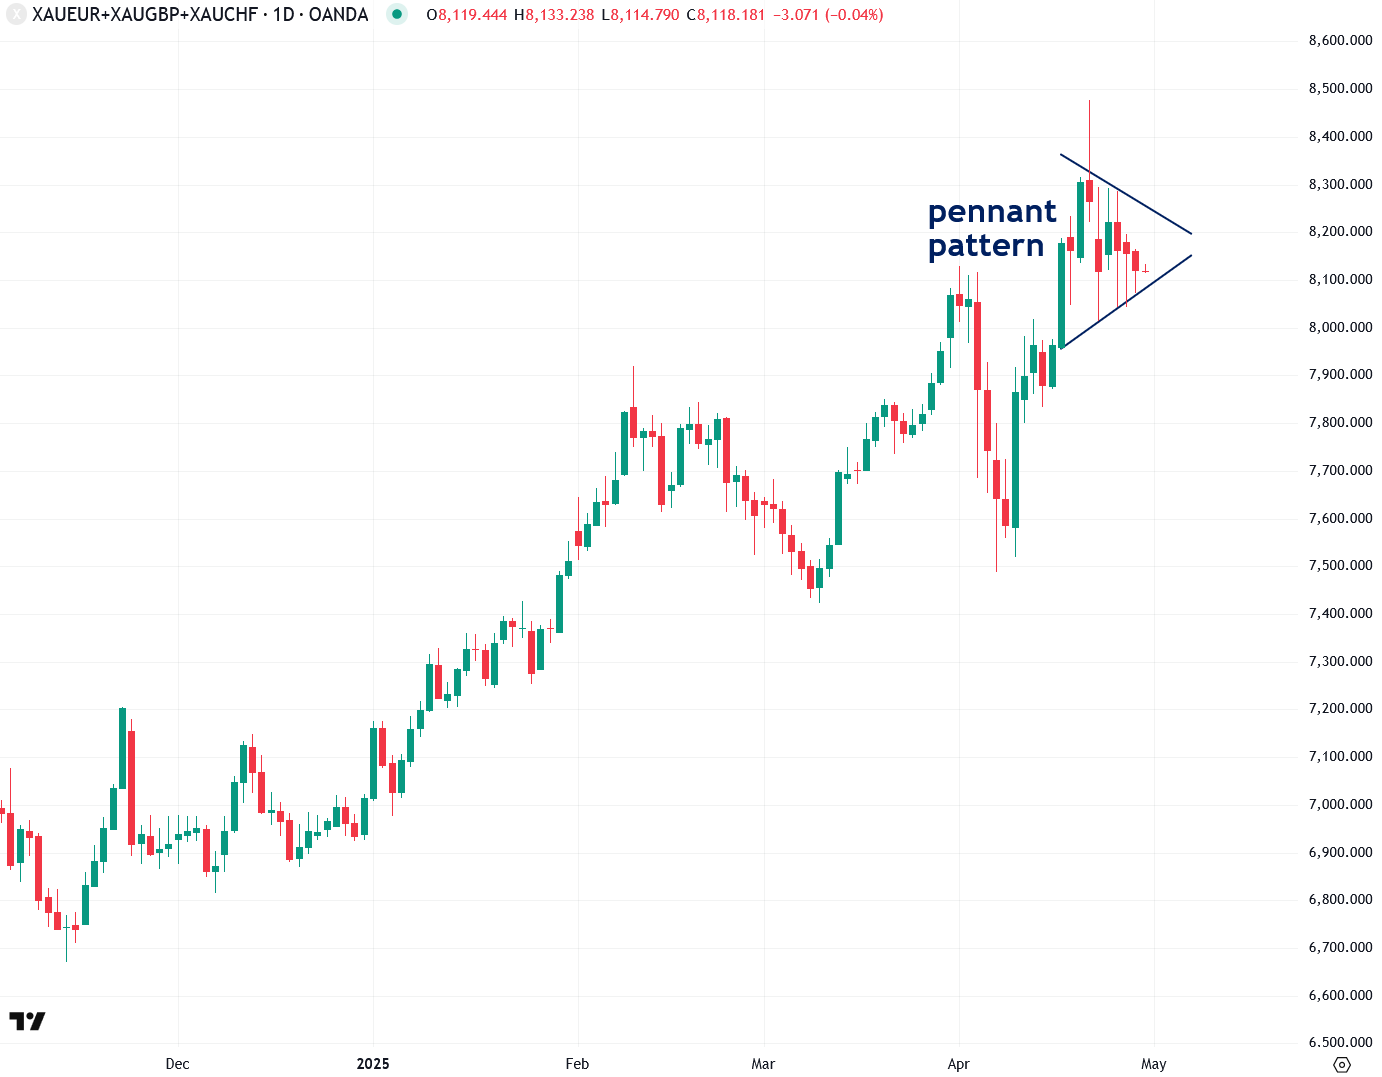
I often like to analyze gold priced in a blended basket of euros, British pounds, and Swiss francs, as it tends to highlight key technical levels with greater clarity—and sure enough, a pennant pattern is forming there as well:
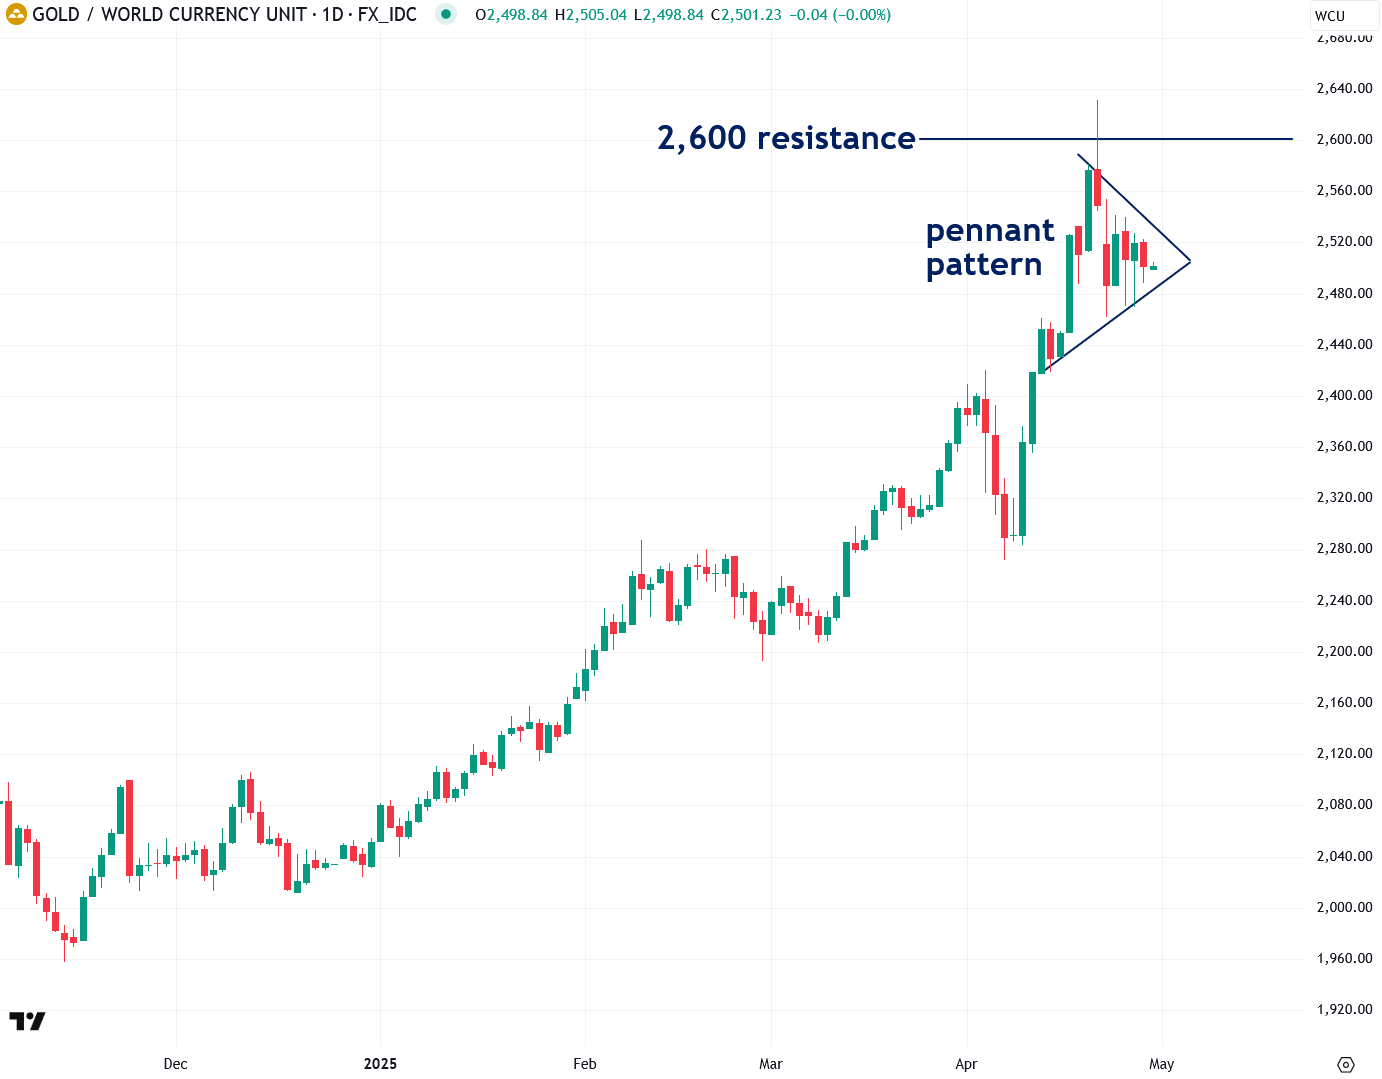
I’ve recently begun tracking gold in World Currency Units (WCU), and it’s also forming a pennant pattern just below the key 2,600 resistance level.
The WCU is a composite global currency unit based on the GDP-weighted average of the top 20 world economies. In many ways, it helps provide the most balanced and accurate measure of gold’s true global performance—which is why I’ve been watching it closely.
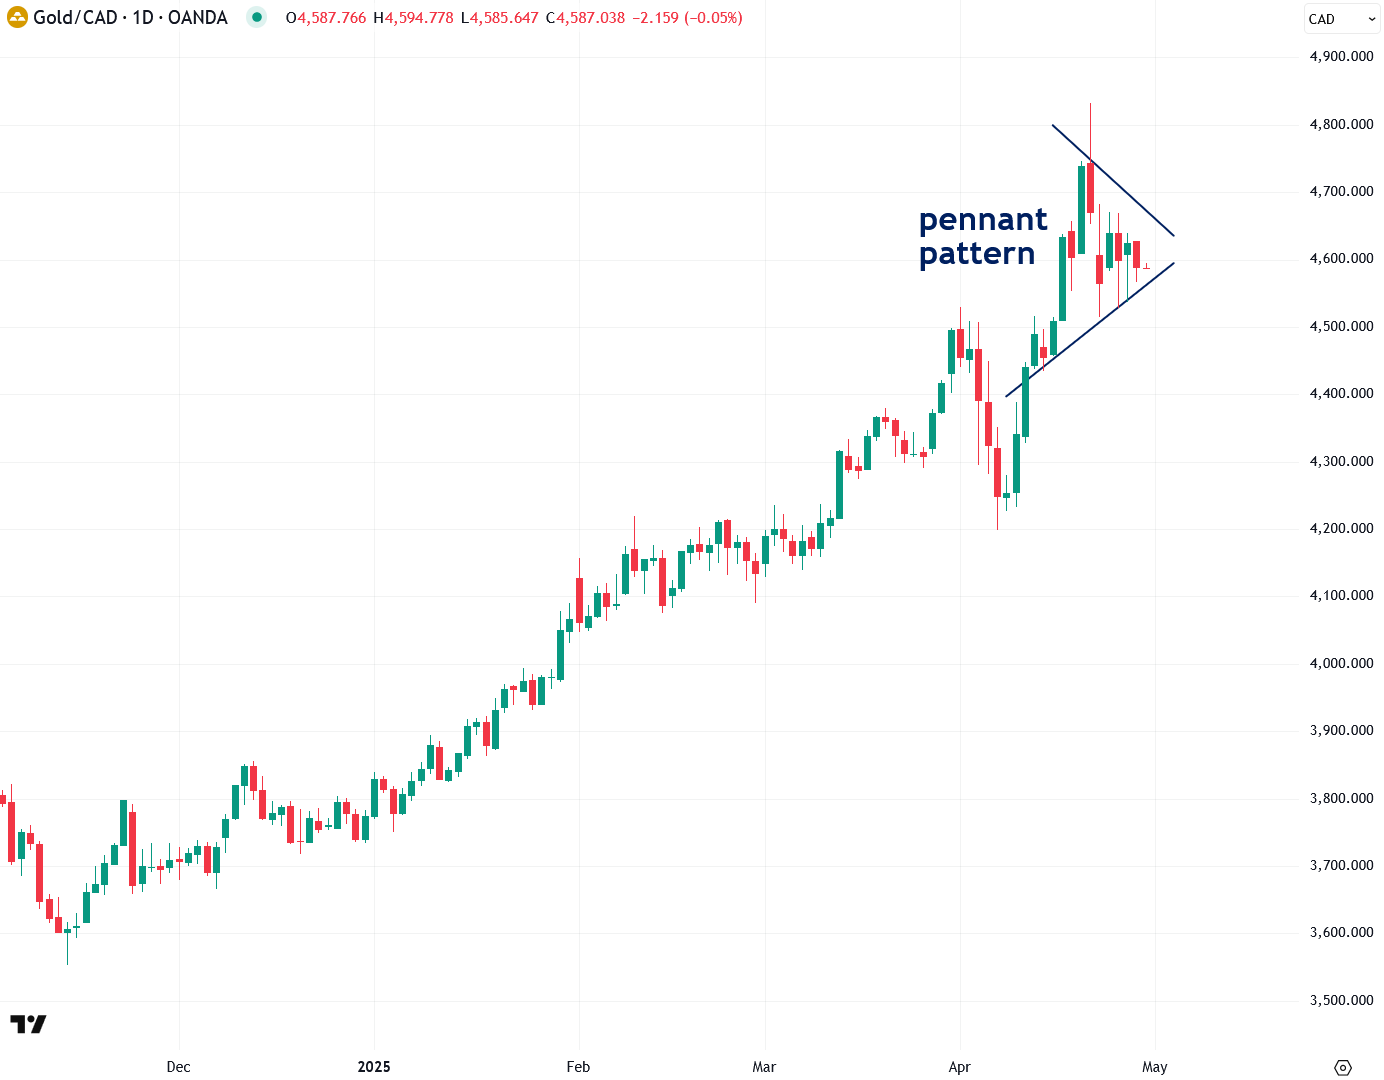
I pay close attention to gold priced in Canadian dollars, as Canada is a major force in the global gold industry. It ranked fourth worldwide in 2023, producing 200 metric tons of gold, and is home to the Royal Canadian Mint—maker of the widely recognized Canadian Gold Maple Leaf coins, a favorite among investors globally.
Sure enough, gold priced in Canadian dollars is also forming a clear pennant pattern:
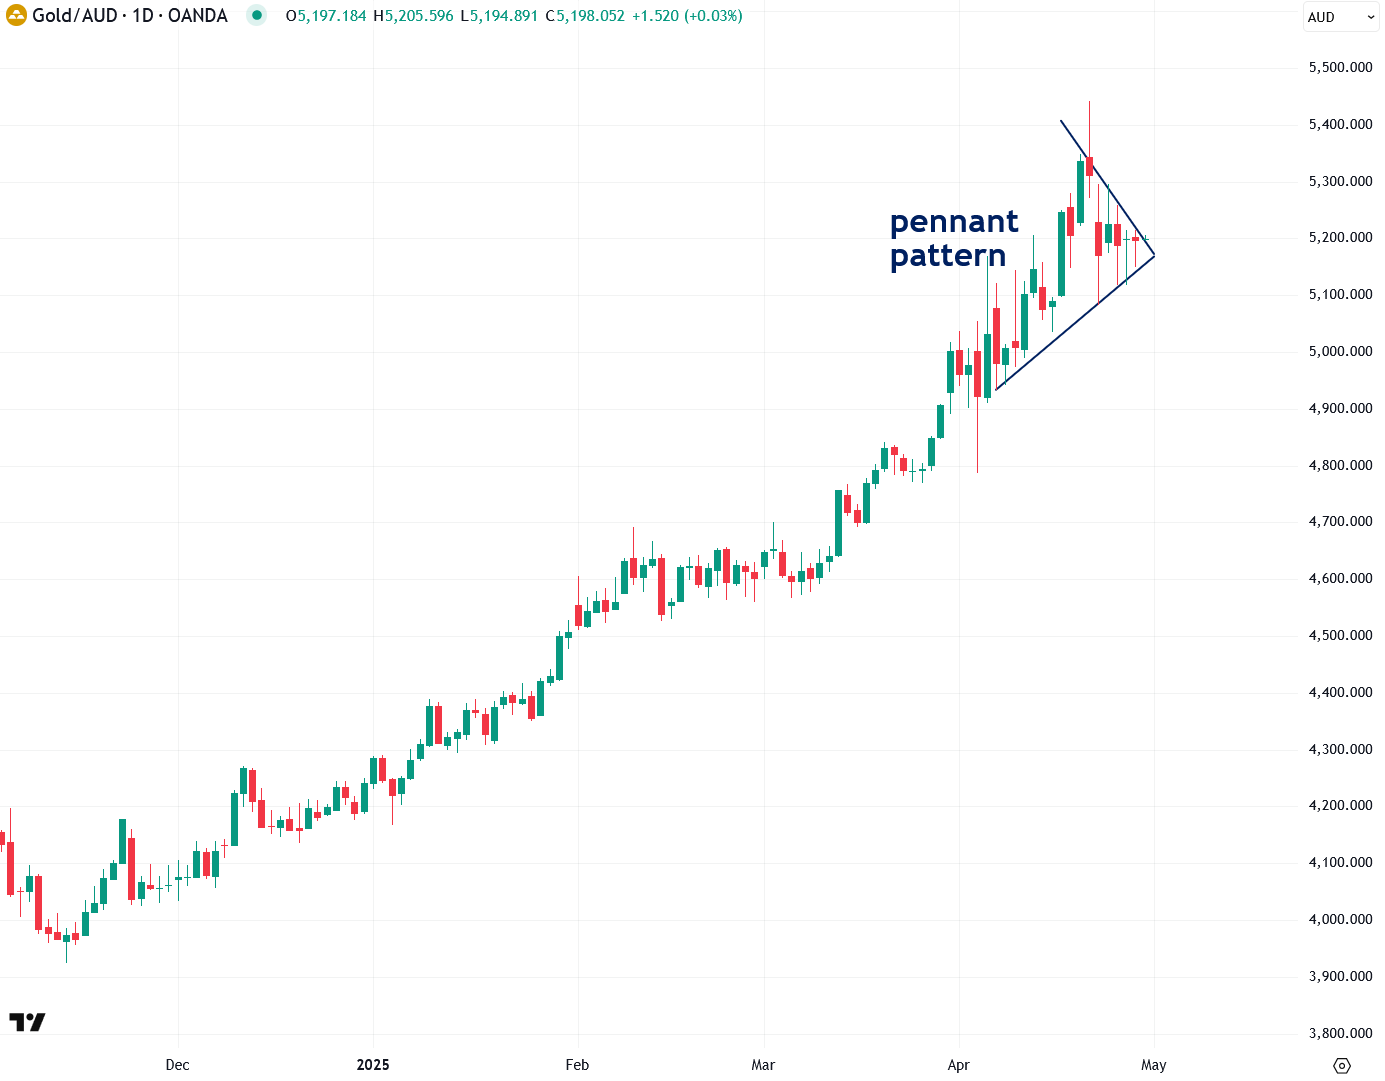
Gold priced in Australian dollars is also worth watching, given Australia’s key role in the global gold market. As the world’s second-largest gold producer—with 310 metric tons mined in 2023—and home to the Perth Mint, which produces the popular Kangaroo gold coins and a widely traded line of gold bars, Australia is a major player in the gold arena.
Interestingly, gold priced in Australian dollars is also forming a distinct pennant pattern:
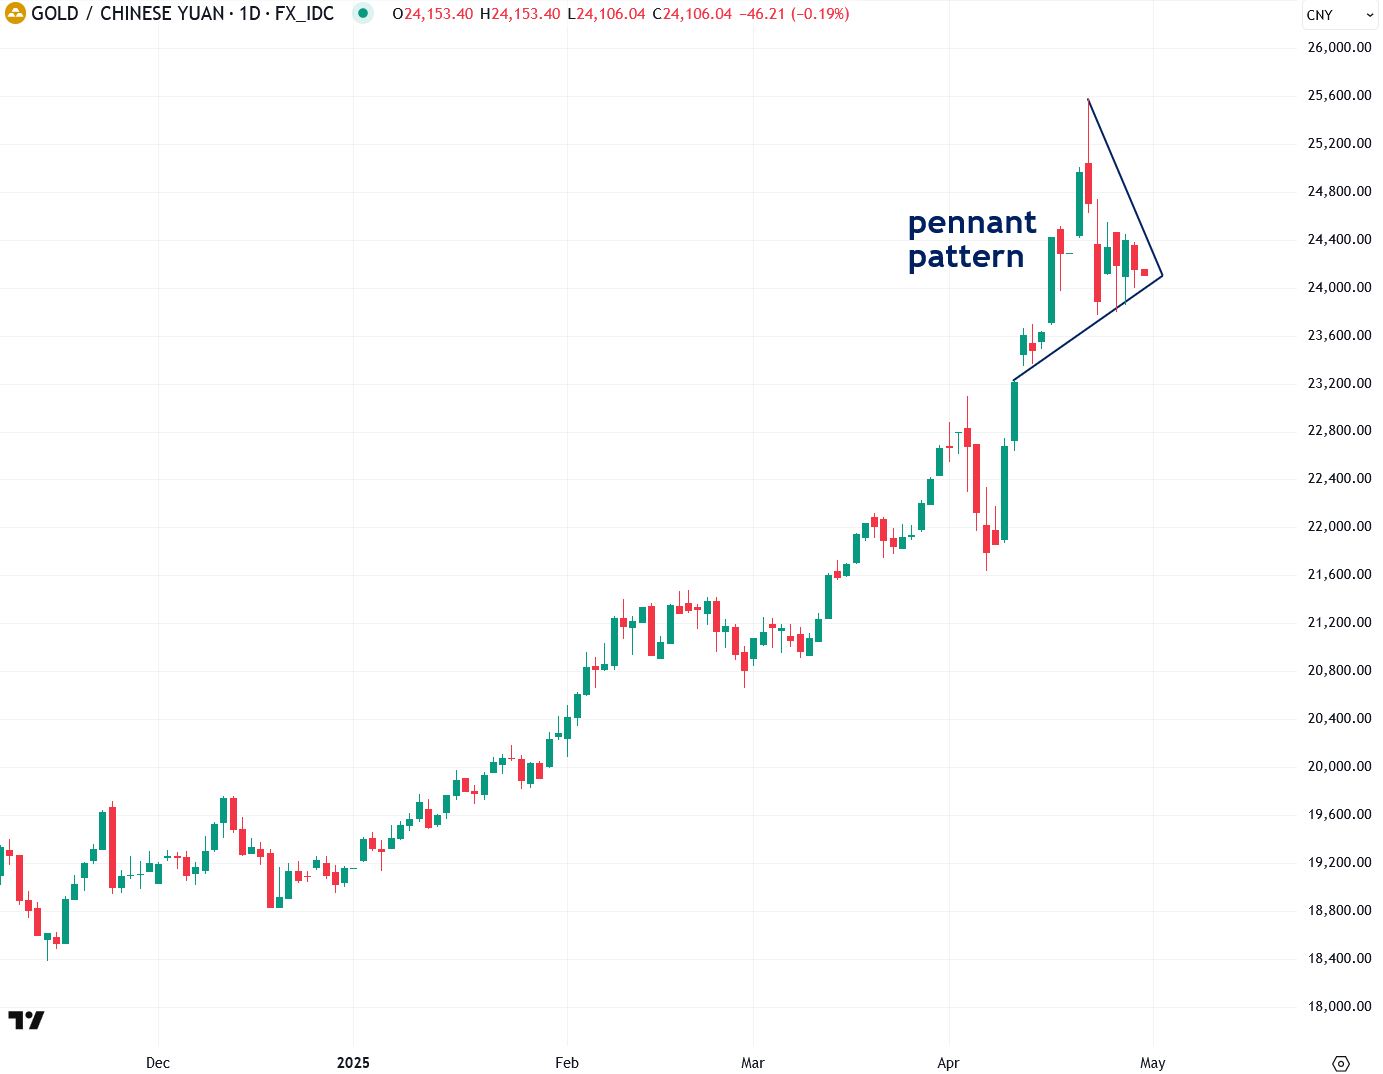
Notably, gold futures on the Shanghai Futures Exchange (SHFE) are also displaying a pennant pattern—an especially important development given the major role Chinese futures traders have played in driving gold’s bull market over the past year:
Gold priced in Chinese yuan is also exhibiting a clear pennant pattern:
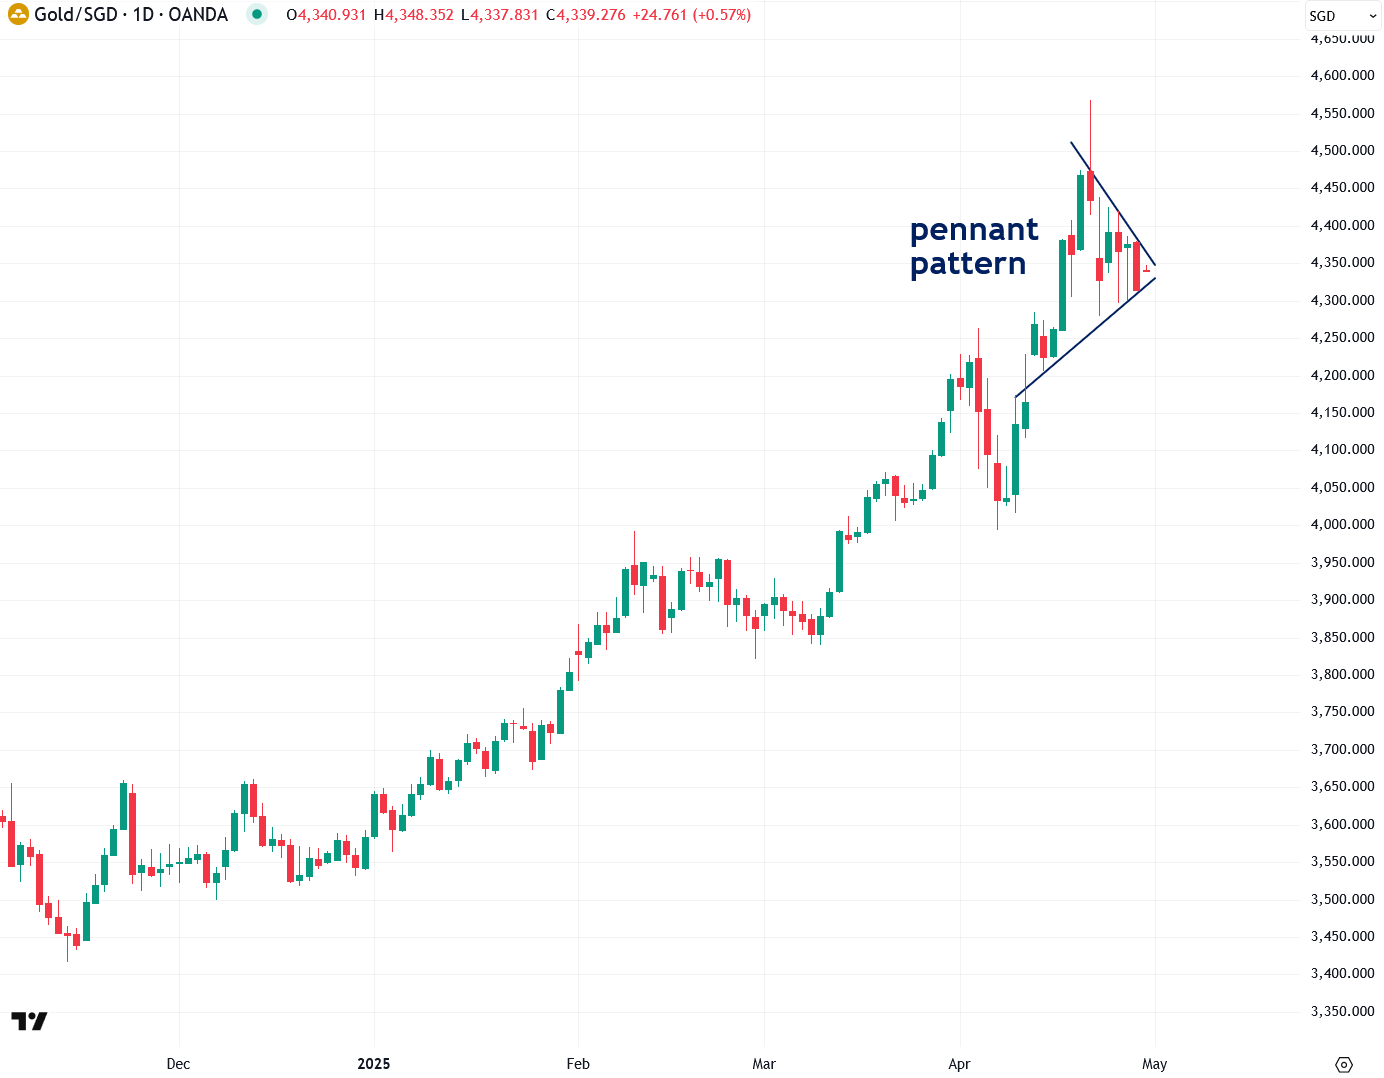
Not to be left out, gold priced in Singapore dollars is also forming a pennant pattern. This chart is particularly noteworthy, as Singapore is a key regional gold trading hub with growing influence in the global gold market. Its strategic position and expanding role in the gold industry make gold priced in Singapore dollars an important indicator to watch.
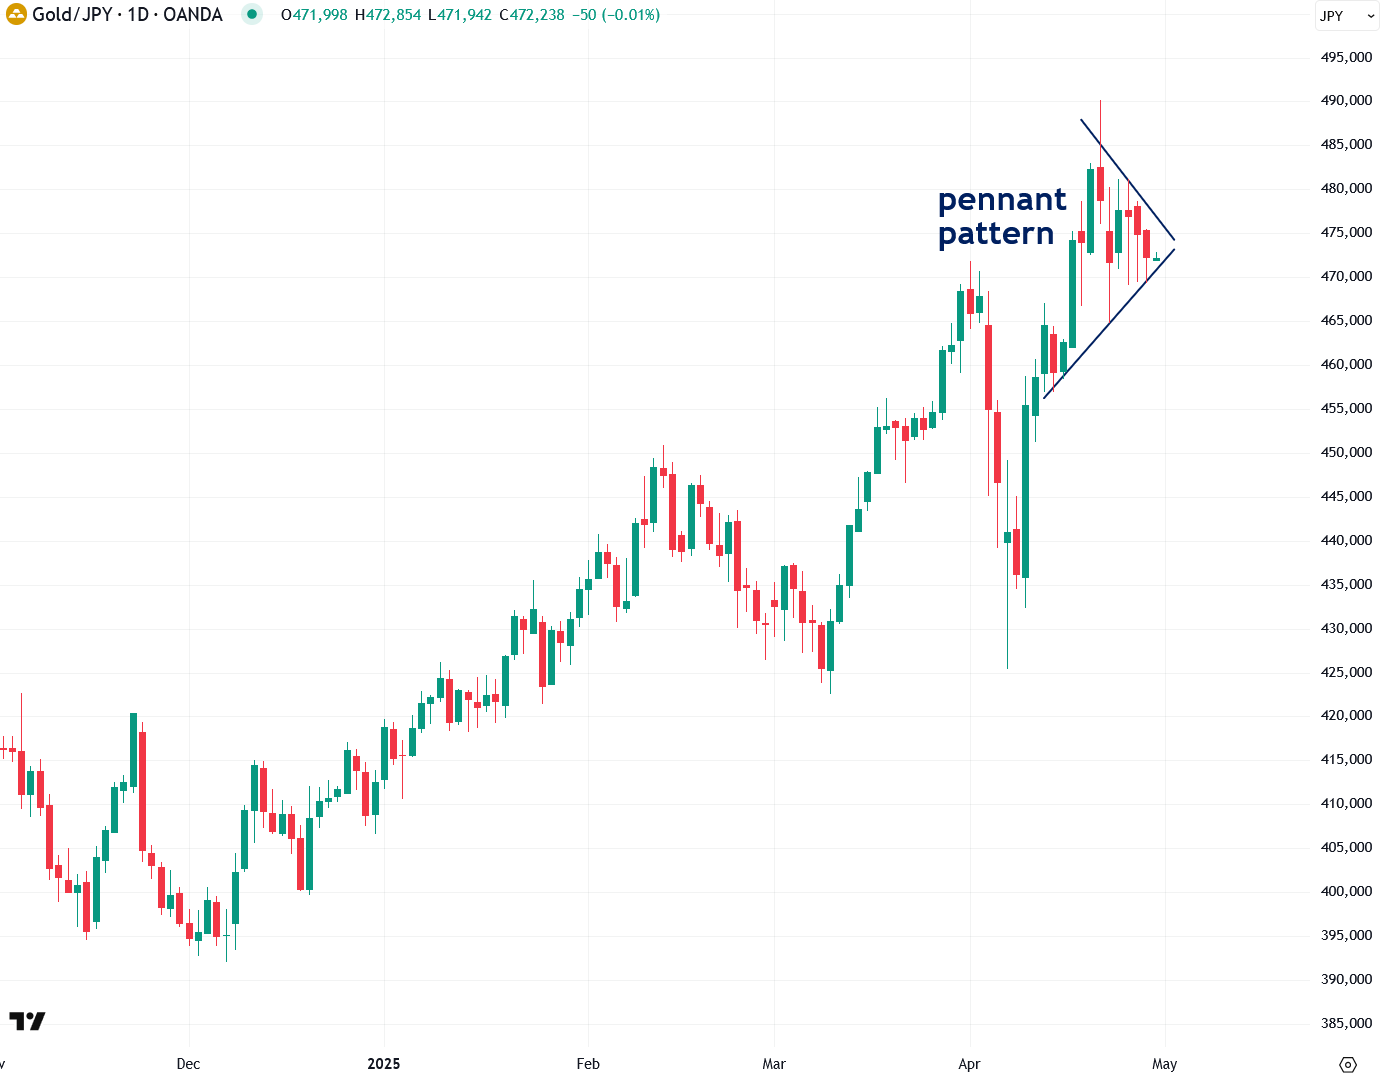
And last but not least, gold priced in Japanese yen is also forming a pennant pattern:
By the way, I want to take a moment to explain that much of the analysis in this article falls under a discipline known as intermarket technical analysis—something I rely on heavily, both for my own investing and in the research I provide in this newsletter.
Intermarket analysis builds on traditional technical analysis by examining key correlations—both positive and inverse—between different asset classes, using the behavior of one market to help forecast movements in another. A clear example from this article is the idea that a bearish move in the U.S. dollar would likely be bullish for gold and other commodities.
If you’d like to learn more about intermarket technical analysis, I highly recommend the book Intermarket Analysis by John Murphy—it’s a classic in the field. I also recently bought the book Intermarket Analysis and Investing by Michael E.S. Gayed, which I’ve heard great things about and plan to read soon.

To sum up, the U.S. dollar, the euro, and gold are all at a critical juncture, with each forming a pennant pattern that’s likely to resolve very soon. The direction of these breakouts will set the tone for the next major move in all three markets. Given that pennants are typically continuation patterns, the odds currently favor a downside break in the dollar and continued strength in both gold and the euro—but as always, it’s crucial to wait for confirmation rather than jump the gun.
I believe a major catalyst—perhaps this Wednesday’s U.S. Personal Consumption Expenditures (PCE) report, Friday’s non-farm payrolls, or a major development on the tariff front—will soon trigger the breakout. One way or another, a big move is coming in both the dollar and precious metals. I’ll continue to keep you updated.
Written by Jesse Colombo for the Bubble Bubble Report