A hand turning two dice that read “covery” and “Silence” as an extension of the word “recovery”
Last week I discussed the balancing act between slowing the rate of economic growth with tighter financial conditions to bring down the rate of inflation and maintaining just enough growth to avert a recession. It is a fine line we must walk to stay on track for a soft landing, but that remains my base case. Investors panicked midweek when the headline inflation number for June hit a new high of 9.1%, increasing the probability of a full-percentage-point rate increase by the Fed at the end of the month to an almost certainty. That sent risk asset prices reeling. Yet the markets staged a huge rebound on Friday, due to a better-then-expected retail sales report for June, as well as forward-looking indicators on the inflation front that tempered expectations of tighter monetary policy.
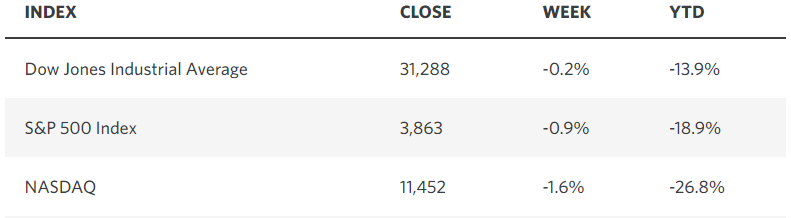
Chart depicting the market averages for S&P 500, Dow Jones Industrial Average, and NASDAQ
Edward Jones
A more pessimistic view of the retail sales report would conclude that the entire gain of 1% in June was a function of higher prices, but the important thing is that consumers were still spending, despite the higher prices. They may be saying they are miserable, but they are drowning their sorrows in bars and restaurants with both discretionary spending categories the largest contributors to June’s gain. This is in no way indicative of a recession, which increases the likelihood that we are still on the path for a soft landing.
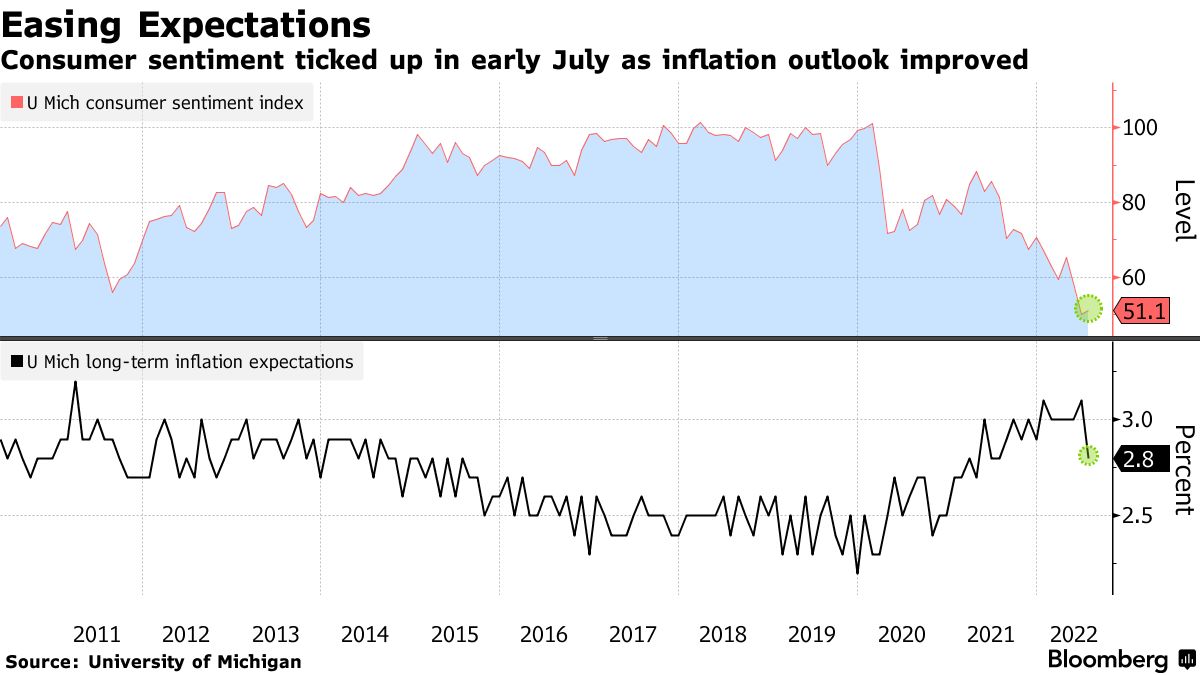
Chart showing how the consumer sentiment index improved in July 2022
Bloomberg
The underlying strength of the retail sales report was coupled with a decline in longer-term inflation expectations in the University of Michigan’s consumer sentiment survey. Consumers now see prices increasing at a 2.8% annual rate over the next five to 10 years, which is down from June’s 3.1% and at a one-year low. They see prices increasing at a 5.2% rate over the next year, which is down from 5.3% last month. As I have said many times before, markets respond to rates of change, and these rates are moving in favorable directions. More good news came from the assessment of current conditions, which rose to 57.1, due largely to the decline in gasoline prices. Overall, the consumer sentiment index nudged modestly higher in July to 51.1, which is just above the June low.
I have discussed many of the commodities falling in price in recent weeks, which should feed into lower prices of goods and services during the second half of this year. The most important of these is oil, which is now resulting in lower prices at the pump. In another development, the supply-chain bottlenecks that led to shortages of just about everything over the past year have now eased in each of the last three months, which should help to further reduce inflationary pressures.
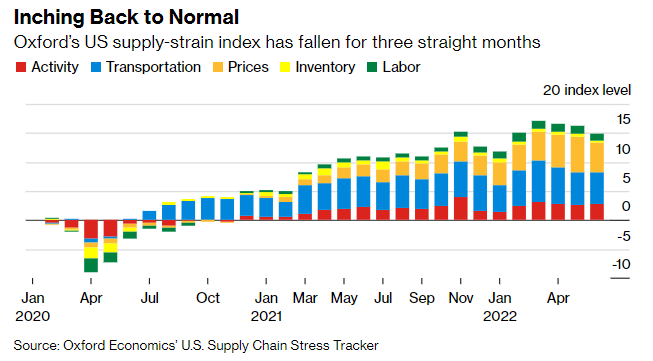
Chart showing the U.S. supply chain index falling for the last three months
Bloomberg
Another way to monitor the health of the global supply chain is to track the number of times the word “shortage” is mentioned in the monthly Beige Book survey conducted by the Fed. Here too we are seeing a gradual healing in the form of fewer references to shortages of materials, workers, and other inputs.
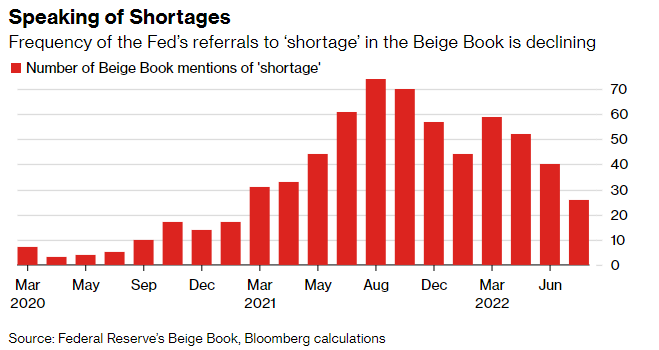
Chart showing the frequency of the Fed’s referrals to a ‘shortage’ in the Beige Book is declining
Bloomberg
The most ardent of bears on Wall Street are now turning to second quarter earnings reports for new reasons to sell stocks with expectations for deteriorating margins, due to rising costs and weakening demand. Yet rising costs and expectations for weakening demand are the reasons why stocks had their worst six-month performance to start a year since 1970! The market discounted this news already, and the stock market indexes will start to rebound well in advance of any improvements in costs or demand. I think that is already happening with June marking the low for this cycle. If stocks don’t look back, the inevitably conversion of Wall Street bears to bulls will provide additional demand for risk assets down the road.
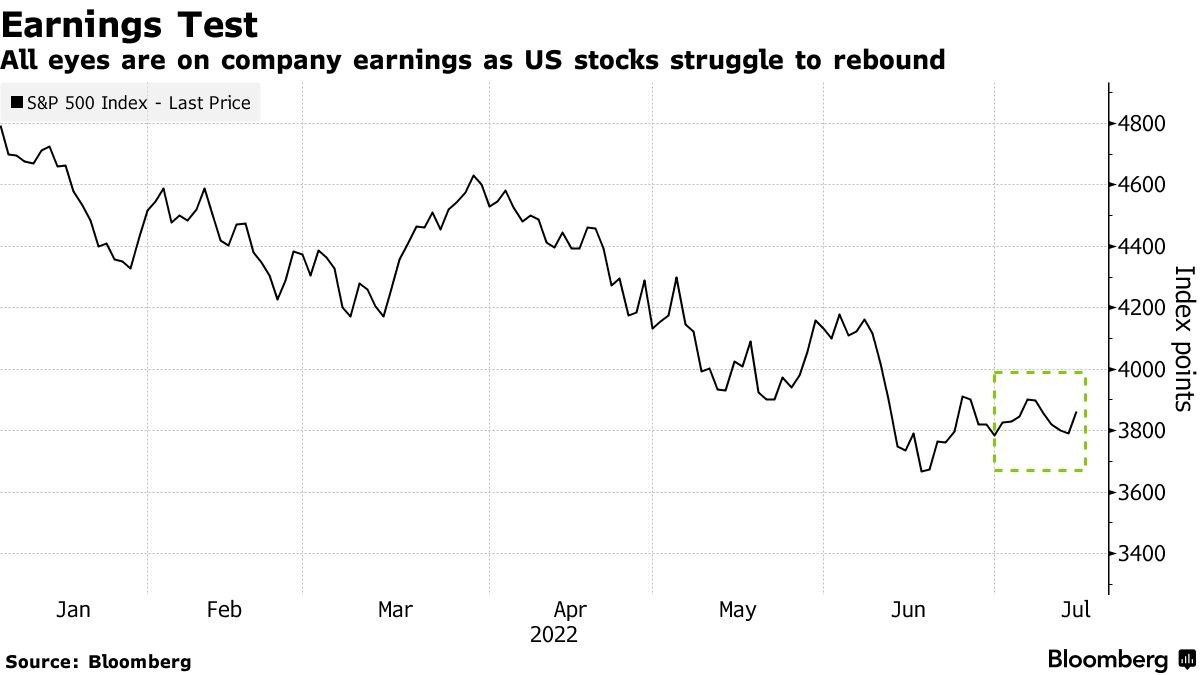
Chart from Bloomberg showing how U.S. stocks are struggling to rebound in the market
Bloomberg
The performance of bank stocks on Friday is a perfect example. After mixed reviews for some of the sectors largest banks, namely JPMorgan and Morgan Stanley, the sector soared at the end of the week to lead the market higher. Valuations are already reflecting a deceleration in business activity, but the stock prices should start to look forward to a second half and 2023 recovery.
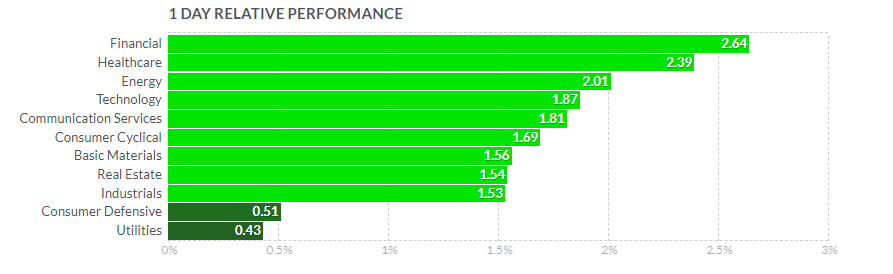
Chart showing the one-day relative performance of financial, healthcare, energy, technology, communication services, consumer cyclical, basic materials, real estate, industrials, consumer defense, utilities.
Finviz
After purging the markets of speculative investment activity over the past year, investment dollars should continue to rotate between asset classes and sectors of the market in search of growth at a reasonable price. I still think the market climbs a wall of worry during the second half of the year, as the consensus shifts its concerns from higher prices to fears of slowing growth.
Economic Data
Housing market data for the month of June is the focus this week, and it show a softening under limited supply and rising borrowing costs. I will be very interested in the mid-month surveys of manufacturing and service sector managers for signs of economic strength and weakness in July.
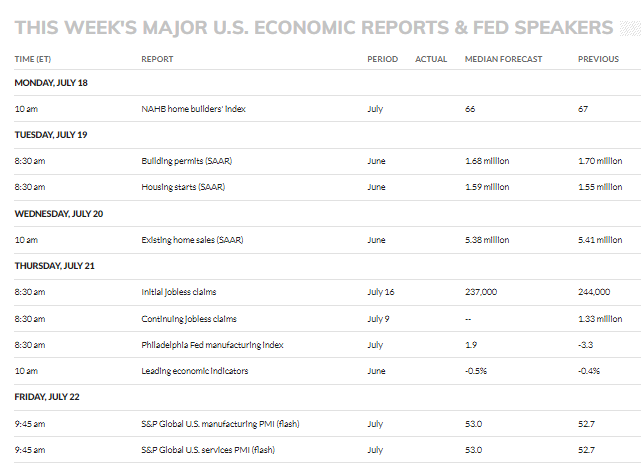
Schedule listing this week’s major U.S. Economic Reports and Speakers
MarketWatch
Technical Picture
We look poised to challenge the 50-day moving averages for all the major market indexes this week, especially with a strong start to trading in the futures markets this morning. That would be the first positive development on the technical front in a long time.
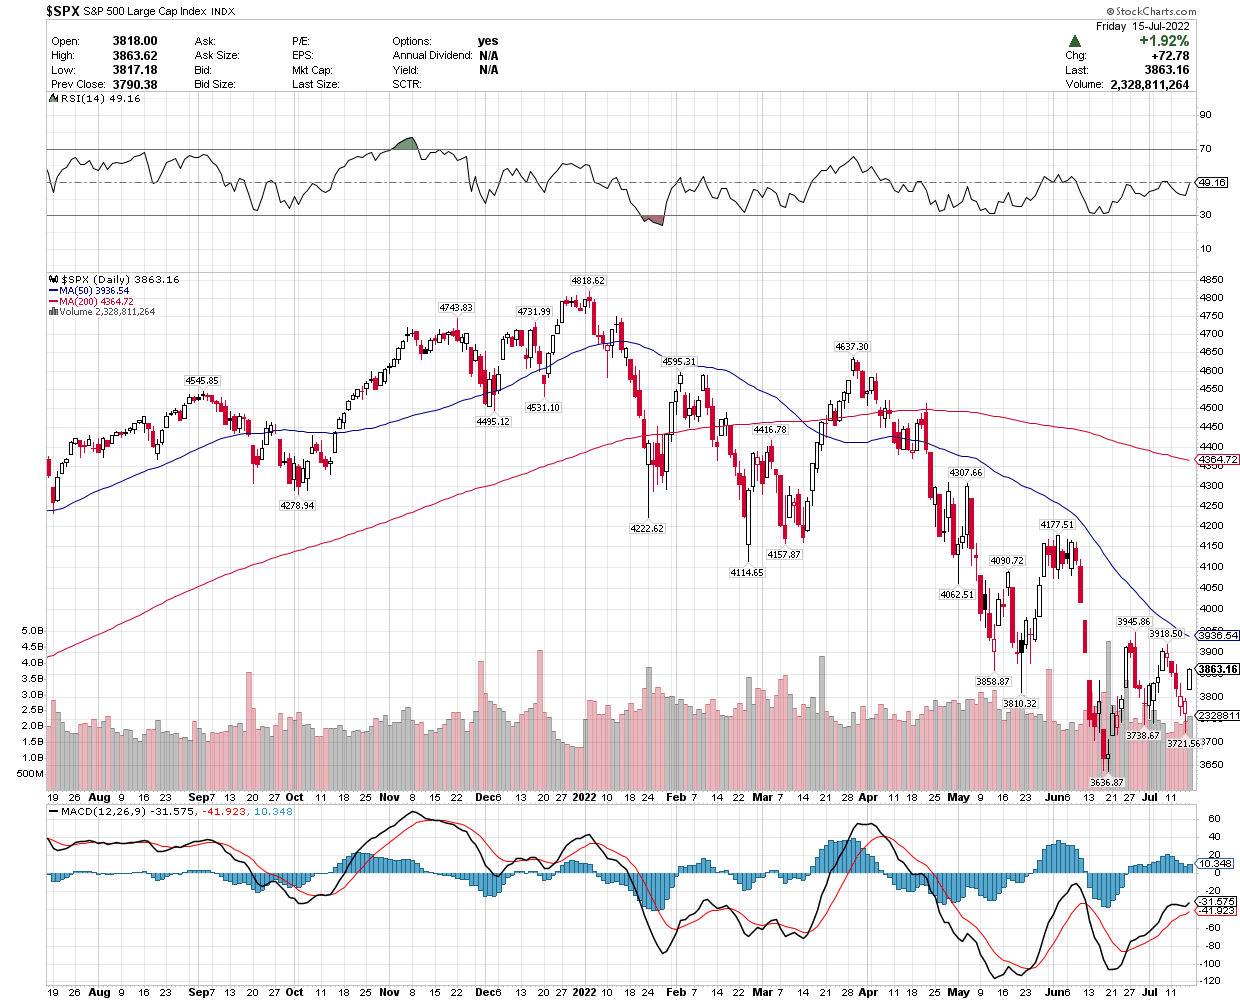
S&P 500 chart
Stockcharts
Shared by Golden State Mint on GoldenStateMint.com